


S&P 500 Reversal Signals Becoming Apparent?
Stock-Markets / Stock Markets 2019 May 04, 2019 - 06:34 PM GMTBy: Submissions

In the early parts of 2019, the biggest stories in the financial markets have become apparent in the S&P 500. Corporate earnings seasons was initially expected to be problematic for several major industry sectors. But quarterly earnings managed to outperform analyst expectations roughly 80% of the releases for the period and this helped propel the main U.S. stock benchmarks back toward record levels.
Near the end of the summer period in 2018, many equities analysts were beginning to think this was unlikely for 2019. Target price projections for several sectors were revised lower, and this led to rising volatility where many of the market’s key tech stock names (i.e. Apple, Amazon, and Microsoft) fell to new short-term lows. In the periods which which followed, however, the S&P 500 has received a forceful round of dip-buying. Very little in the way if technical price retracement has been visible, but this is not always the type of trend market watchers hope for in terms of long-term sustainability.
In other words, it is often viewed as “healthy” for stock markets to experience corrective downside. But there have been limited bear waves in this impulsive bull wave pattern which has developed since last December. Now that we have officially moved into record territory in the S&P 500, we may start to be vulnerable to clear breaks of support.
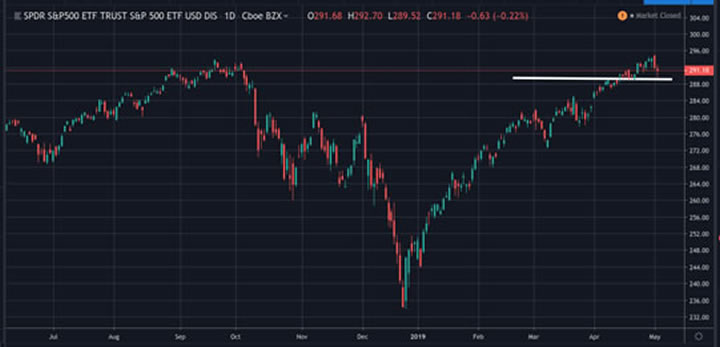
In the chart above, we have outlined an important historical support zone for the S&P 500 Trust Fund (NYSE:SPY) at $289.40. This is an important level of short-term price support which may contain market tests on first bounce. However, any significant break of this level could leave the fund vulnerable at its highs, given the recent strength (and limited pullbacks) traders have witnessed in the S&P 500. Since this benchmark represents the broadest cross-section of stocks, traders will more than likely need to assess the upcoming earnings outlook for individual industry sectors. This is mainly because we are already seeing some strong divergences between the tech, industrial, and healthcare segments of the broader stock exchanges.
Nonetheless, analyst projections have been fluctuating greatly over the last several weeks, and it seems that the market is currently unclear about the prospects of heightened revenue generation for the second quarter. If these projections remain the same into the end of the month, it seems that falls in the S&P 500 will lead to a drop in SPY through our aforementioned support levels at $289.40.
By Ask Traders
© 2019 Copyright Ask Traders- All Rights Reserved
Disclaimer: The above is a matter of opinion provided for general information purposes only and is not intended as investment advice. Information and analysis above are derived from sources and utilising methods believed to be reliable, but we cannot accept responsibility for any losses you may incur as a result of this analysis. Individuals should consult with their personal financial advisors.
© 2005-2022 http://www.MarketOracle.co.uk - The Market Oracle is a FREE Daily Financial Markets Analysis & Forecasting online publication.