


Stocks, Oil, Gold: Inflation-Adjusted Returns
Stock-Markets / Financial Markets 2019 May 07, 2019 - 06:52 PM GMTBy: Kelsey_Williams

 In late 1999, the hyper-bullish technology stock sector was nearing the end of its nearly decade-long run to unsupportable and overly optimistic highs. At the center of the hype and fascination were new companies, headed by twenty-something geniuses. They were referred to as startups.
The multiples of earnings that normally applied in order to assess value of these companies was thrown aside. That is because most of them did not have any earnings.
Nevertheless, they were attractive enough to garner huge crowds of support. Just the hint of a revolutionary idea could boost an unknown small private company into the spotlight of the new issue market with over subscription being commonplace.
Technology stocks collapsed in 2000, and were eventually joined by the broader stock market which began a two-year descent that saw the S&P 500 lose fifty percent of its value.
Nearly smack in the middle of this two-year decline in stock prices came the 9/11 tragedy. Shortly after that the market bottomed, but before it could get untracked and head back up in earnest, there was a mutual fund “scandal”.
Then in 2006, real estate prices peaked – and cratered. Most of the damage was in residential real estate where it seemed to be the most extensive. It was definitely the most obvious.
Foreclosures were rampant and an entire cross-section of the population was in transit, moving from their recently acquired new homes and into rentals, if they could find one.
Economic fallout spread to major investment banks and the stock market. Financial institutions with household names like Lehman Brothers, Merrill Lynch, Washington Mutual, and AIG were skewered.
The stock market finally recognized how bad things were. Beginning in August 2007, and continuing for the next eighteen months, stock prices declined with a vengeance. The overall market, as reflected by the S&P 500, lost nearly two-thirds of its value.
In February 2009, a bottom was reached. The past ten years has seen the market surge to new all-time highs, seemingly much higher than could have possibly been anticipated just a few years ago.
The S&P 500 has increased in value four-fold from its low of 735 ten years ago to its most recent high of 2945.
It seems hard to believe, and it strengthens the argument for long-term investing in stocks and staying the course. But maybe things are not quite what they seem. Lets take a look.
Below is a chart (macrotrends.net) of the S&P 500 for the past twenty years. The data are inflation-adjusted using the headline CPI and plotted on a logarithmic scale.
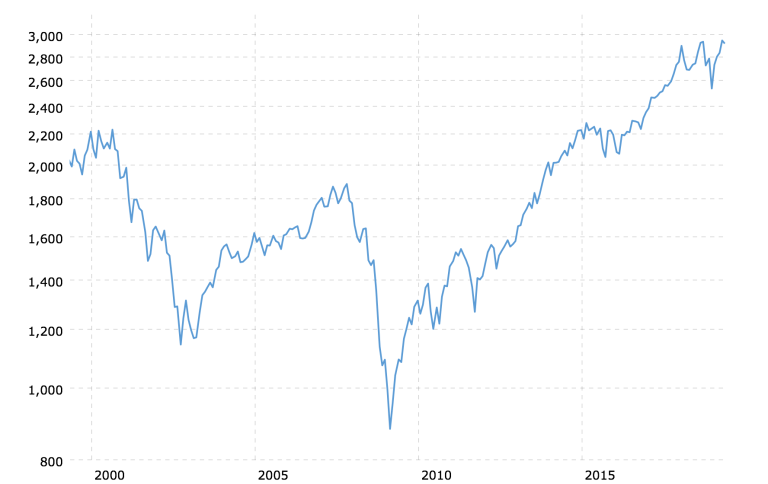
From this chart we can see that, in real terms, stocks did not get back to their highs of 2000 until fifteen years later, in February 2015. Even without the adjustment for inflation, stocks did not reach and exceed their 2000 peak until thirteen years later, in March 2013.
Also, we see that six of the past ten years were spent in recovering lost ground. The new highs and additional growth has come only in the past four years.
Fifteen years seems like an inordinately long time to wait for the market to assert itself and return to any expected pattern of normal growth. And you would have had to endure pure hell to see it happen.
And while the six and one-quarter percent average annual real rate of return over the past ten years is not inconsistent with the stock market’s long-term average annual return of about seven percent on an inflation-adjusted basis, it is too convenient to describe it as a return to normal.
A clearer picture of the stock market’s performance is found in looking farther back on the time line. The stock market’s (S&P 500) total return for the nineteen years beginning in January 2000 and ending in December 2018 is about fourteen percent, on an inflation-adjusted basis.
This equates to an average annual real rate of return on stocks of slightly more than seven-tenths of one percent for the first two decades of this century. That is not even close to the seven percent average annual return on an inflation-adjusted basis that stock market proponents are fond of citing.
In other words, the stock market returns for the this century are ninety percent less than their long-term average.
Below is a chart (macro trends.net) of crude oil for the past twenty years. As with stocks above, the price of crude oil is also adjusted for inflation and plotted on a logarithmic scale.
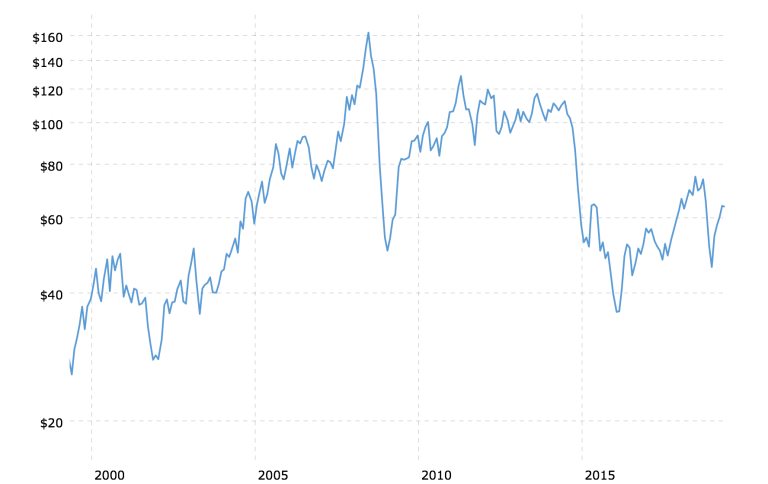
For eight years between 2000 and 2008, the price of crude oil quadrupled in real terms. After that, and in concert with stocks above, it lost two-thirds of its value, bottoming in January 2009, one month earlier than stocks.
Unfortunately for crude oil, that was not the bottom. After recovering a major portion of its losses it began another extensive decline in price in mid-2014. Then, after bottoming in early 2016, the price of crude oil doubled and then fell back to its recent low of close to $45.00 per barrel in December 2018.
After nineteen years of exclamatory volatility, crude oil at the end of last year was exactly where it was in February 2000 on an inflation-adjusted basis – $45.00 per barrel.
Now lets look at gold. The chart below, as with stocks and oil above, shows prices for gold over the past twenty years and is inflation-adjusted, too, and plotted on a logarithmic scale.
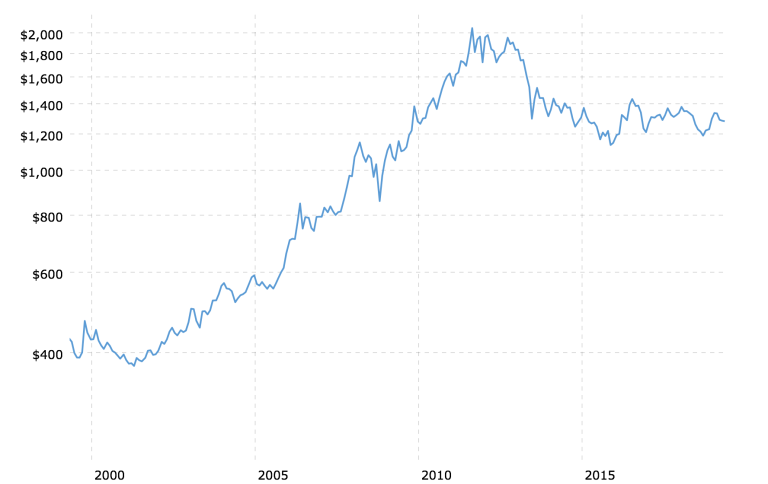
It seems somewhat ironic, but gold appears to be much less volatile than either stocks or oil. For the first eleven years of this century, the price of gold was steadily increasing, as contrasted with the extreme action and counteraction in the prices of stocks and crude oil.
Also, in stark contrast to stocks and oil, the price of gold actually increased substantially over the past two decades. Even after a drop in price of almost one-third since its high in August 2011, the price of gold ended 2018 more than three times higher than where it started the century in January 2000.
The three-fold increase (two hundred percent total return) equates to an average annual increase of six percent, which is nine times greater than stocks for the same period. And it is infinitely greater than crude oil which ended the same nineteen year period unchanged.
Kelsey Williams is the author of two books: INFLATION, WHAT IT IS, WHAT IT ISN’T, AND WHO’S RESPONSIBLE FOR IT and ALL HAIL THE FED!
By Kelsey Williams
http://www.kelseywilliamsgold.com
Kelsey Williams is a retired financial professional living in Southern Utah. His website, Kelsey’s Gold Facts, contains self-authored articles written for the purpose of educating others about Gold within an historical context.
© 2019 Copyright Kelsey Williams - All Rights Reserved Disclaimer: The above is a matter of opinion provided for general information purposes only and is not intended as investment advice. Information and analysis above are derived from sources and utilising methods believed to be reliable, but we cannot accept responsibility for any losses you may incur as a result of this analysis. Individuals should consult with their personal financial advisors.
© 2005-2022 http://www.MarketOracle.co.uk - The Market Oracle is a FREE Daily Financial Markets Analysis & Forecasting online publication.