


Strong Stock Market Rally Expected
Stock-Markets / Stock Markets 2019 May 15, 2019 - 03:17 PM GMTBy: Brad_Gudgeon

 The stock market fell in capitulation on Monday, a ‘c’ of “z” type wave that got everyone beared-up. Monday was the 16 TD low and could be the 20 week low as well (94 trading days of the 100 trading day low 15 trading days). The ten week went 49/50 trading days in early March, which is normal. As of Monday we saw 44/45 trading days, which could complete a 10/20 week low pattern (at least 2 ten week patterns).
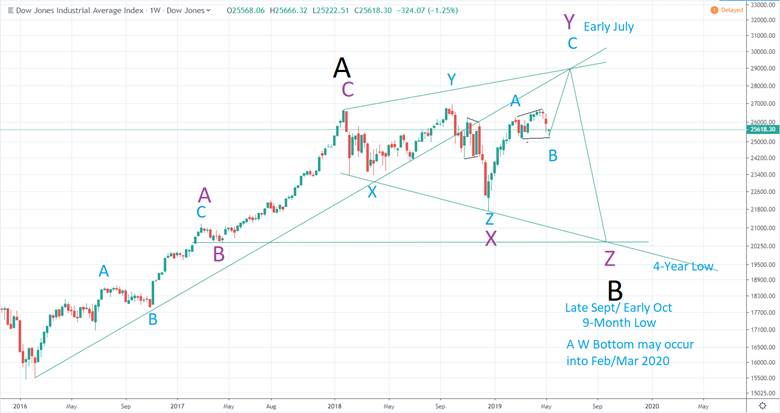
The Dow 30 looks to have made a possible xyz type of B wave bull flag Monday (at least it could be viewed that way by traders). The Dow topped on April 23rd where the SPX topped on May 1, 6 trading days later, making a “b” wave for the Dow, but an irregular “y” wave top for the SPX. It is possible from this configuration that we could see a strong wave of buying into May 21st and then a hard drop into June 5th (110 trading days and 16 trading days from May 13th).
So, we are not out of the woods just yet. My preferred count is a strong rally into early July from May 13th then down into late Sept/early October. The normal 4-year cycle has the July top late in the month or even in early August. For this to happen, we need another big drop like Jan-Feb 2018 from May 21-June 5 to finish Wave B. The reason is, C would = A in time in price. This is called the Equality of Waves Principle.
Below, I have my preferred count (on shaky ground as I mentioned) and that is Wave B of “Y” terminated May 13th and it rallies hard into early July. Early July is 9 months (39/40 week cycle) from the October 2018 top. The recent irregular top on the SPX on May 1 has me concerned that I could be wrong as wave ‘z’ would have counted out –xyz- itself, which is not likely with this kind of formation. It could be xyz “x” May 13th and then “y” into May 21 with “z” of Z into June 5th.
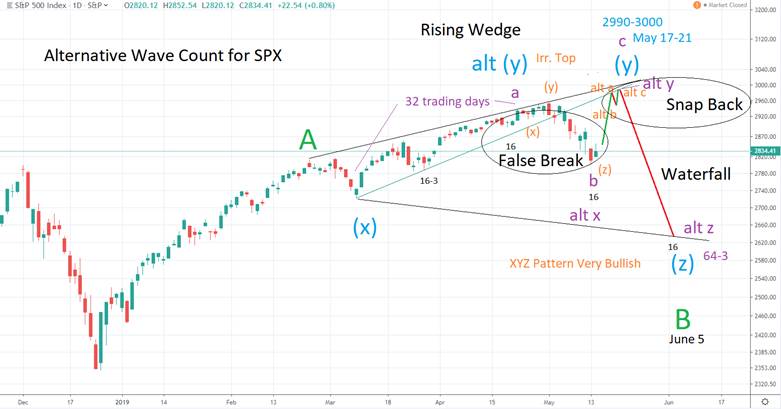
If I’m wrong, at least we have a strong wave back up into May 21 to above the last top near SPX 2954 and that would count as “y” of an xyz Z Wave pattern). 2980 beckons this Friday with 2990/3000-ish by May 21. The day after OPEX could sell-off hard as Mercury trines Pluto over the weekend. Mercury trines Saturn on Thursday and that set-up portends a bullish tone for Friday, as we squeeze in between the two aspects. The week looks bullish to me. Whatever comes after that may end up being the rub, we’ll see. It bears watching May 21st through May 28th. If the 28th fails to go higher than May 21st, watch out below!
Gold and the miners have diverged, as gold has become overbought while the mining sector is becoming oversold. My take is, we have one more down draft for both into late next week to fulfill four 9-week cycle lows (36 weeks). GDX could go below 19.00. If it does, my opinion is that it will be a nice buying opportunity with a target of 26 in the coming months.
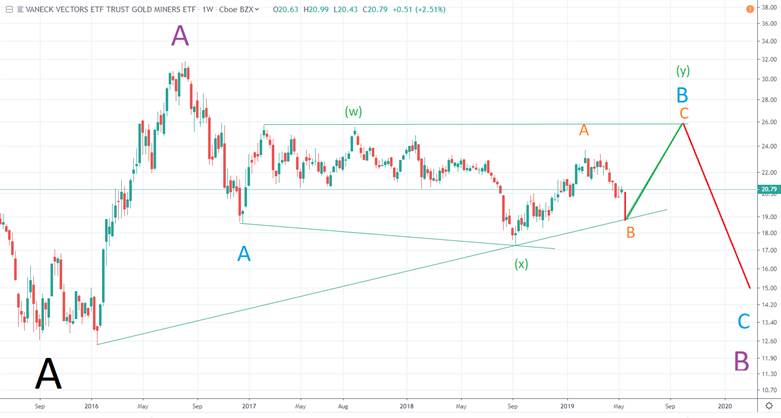
As you can see by the weekly chart above, I believe this to be a counter trend ABC rally. The best buying opportunity may be early next year if the 4 year cycle has anything to do with it.
The chart below of the S&P 500 has my alternate count, which suggests a move to new highs by May 17-21 and then a hard drop into June 5th. The irregular top of May 1 and the xyz pattern (in orange) from April 23-May 13 is very bullish for the short term. The alternative wave count has a huge drop from May 21st - June 5th.
Normally, when there is a break of a Rising Wedge, the expectation is for a false break, a rebound back to or inside the wedge (snap back rally) and then a water fall type decline. This alternative count , if it happens places the C wave top out toward August 1, and not early July (as the Dow charts show) with an equal wave of time and price. With the Trump/China banter going on, this could be what happens.
Brad Gudgeon
Editor of The BluStar Market Timer
The BluStar Market Timer was rated #1 in the world by Timer Trac in 2014, competing with over 1600 market timers. This occurred despite what the author considered a very difficult year for him. Brad Gudgeon, editor and author of the BluStar Market Timer, is a market veteran of over 30 years. The website is www.blustarmarkettimer.info To view the details more clearly, you may visit our free chart look atwww.blustarmarkettimer.com
Copyright 2019, BluStar Market Timer. All rights reserved.
Disclaimer: The above information is not intended as investment advice. Market timers can and do make mistakes. The above analysis is believed to be reliable, but we cannot be responsible for losses should they occur as a result of using this information. This article is intended for educational purposes only. Past performance is never a guarantee of future performance.
Brad Gudgeon Archive |
© 2005-2022 http://www.MarketOracle.co.uk - The Market Oracle is a FREE Daily Financial Markets Analysis & Forecasting online publication.