


This Ultimate Formula Will Help You Avoid Dividend Cutting Stocks
Companies / Dividends May 24, 2019 - 03:15 PM GMTBy: Robert_Ross

 Many of you probably don’t have a telephone at home.
I’m not talking about a cell phone. I’m talking about a phone plugged into the wall.
The US Health Department reports that only 6.5% of homes are landline only, and most of them are in rural areas.
One company that services these stalwart landline customers is CenturyLink (CTL). It’s not a high-growth business, but its stable customer base made it a prime target for income investors.
This was doubly true after CenturyLink spiked its annual dividend from $0.26 to $2.17 in 2008. That lifted the company’s dividend yield to a hefty 7%.
That’s more than triple the current dividend yield of the S&P 500.
Don’t get me wrong, there’s a way to earn high dividends without having to risk your neck, but CenturyLink was not the case.
Let’s look at how it all came crashing down and what we can learn from it.
Hypnotized by High Dividend Yields
From 2008 to 2013, CenturyLink began buying up smaller telecoms that were struggling due to the financial crisis. The strategy was to grow sales—and it worked. Sales ballooned 38% per year during that six-year stretch.
During those years, CenturyLink paid the coveted 7% dividend like clockwork. Although the stock price didn’t move much, it was a hot income investment.
To income investors, it all made sense. CenturyLink looked like a stable business that generously rewarded shareholders.
But if you looked under the hood, CenturyLink was a mess.
And those who missed the warning signs were punished with a devastating dividend cut in 2013.
Investors can often get suckered in by high dividend yields.
An investor looking at CenturyLink could have easily thought, “Wow, I can earn 7% with little to no risk.”
That thinking worked for a while. But in 2009, CenturyLink started piling on debt. Lots of debt.
That’s not uncommon in the telecom industry, as these businesses need a lot of capital.
But it didn’t take long to see that the debt was being mismanaged. And when a company abuses its finances, a desperate search for ways to cut costs soon follows.
And one of the first targets is a high dividend.
Spotting Ticking Dividend Time Bombs
There are a handful of ways to gauge the safety of a dividend.
One of them is to look at a company’s debt-to-equity ratio.
This ratio tells you how much of a company’s operations are being funded through debt (i.e. borrowed funds) or equity (i.e. owned funds).
The higher this figure, the worse a company’s financial position. From 2009 to 2013, CenturyLink’s debt-to-equity jumped from 77% to 117%.
Anything over 80% is a red flag. And CenturyLink was well beyond that point.
There were other warning signs. CenturyLink’s net income and free cash flow were falling. These yardsticks measure how much profit the company generated (i.e. net income) and how much cash was left over to invest (i.e. free cash flow).
If a company is not making money (i.e. falling net income and free cash flow), it affects another key measure: the payout ratio. This is what happened with Kraft Heinz before it was forced to cut its dividend.
This is the most important number on the dividend safety barometer. The payout ratio is the percentage of net income a firm pays to its shareholders as dividends.
The lower the payout ratio, the safer the dividend payment.
And by 2013, the payout ratio for CenturyLink had reached an absurd 232%. That means for every $1.00 in profit the company was paying out $2.30 in dividends.
CenturyLink’s dividend was a house of cards. And it all came crashing down on February 14, 2013:
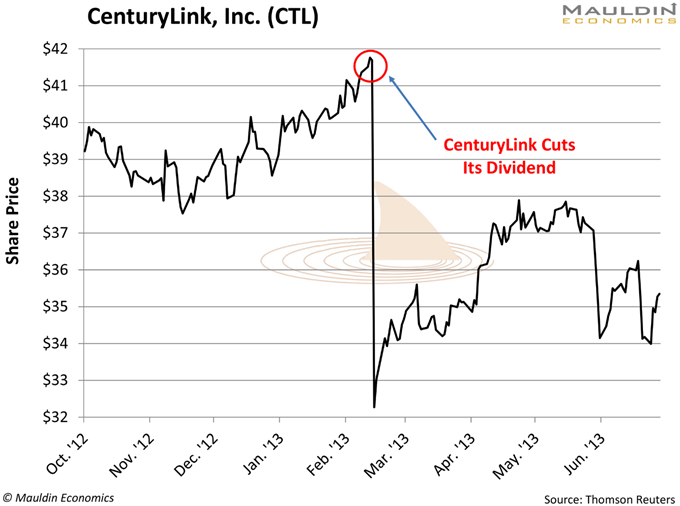
On that day, CenturyLink cut its dividend by 25%. The move sent its shares on a 23% plunge in a single day.
Keeping an Eye Out for Warning Signs
Stable and boring businesses like telecom companies are great. In fact, I love boring companies.
That’s why we have a few of them in my portfolio, which you can check here,
But anyone who says there weren’t warning signs with CenturyLink wasn’t looking hard enough.
While every company needs a good story behind it for an investment to make sense, the data better make sense as well.
For that, I developed a scoring system called the Dividend Sustainability Index (DSI).
I use the DSI to measure a company’s debt-to-equity, net income margin, free cash flow growth, and payout ratio to determine the safety of its dividend.
The higher the DSI score, the safer the dividend.
To show you how well it works, I went back and ran CenturyLink’s data through the DSI.
Here’s how the company scored before it was forced to cut its dividend:
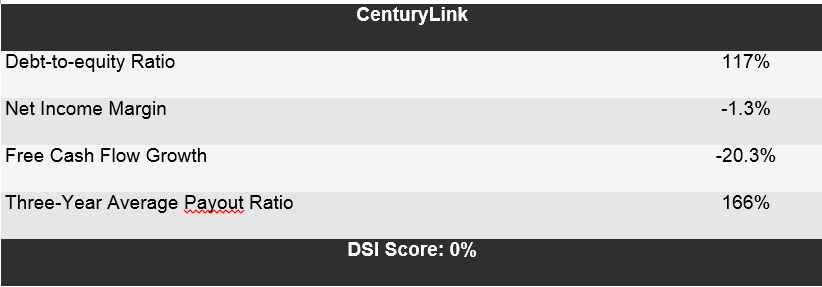
Source: Mauldin Economics
My general rule of thumb is that a company must have a DSI score of 75% or higher to make it into my portfolio.
The Sin Stock Anomaly: Collect Big, Safe Profits with These 3 Hated Stocks
My brand-new special report tells you everything about profiting from “sin stocks” (gambling, tobacco, and alcohol). These stocks are much safer and do twice as well as other stocks simply because most investors try to avoid them. Claim your free copy.
By Robert Ross
© 2019 Copyright Robert Ross. - All Rights Reserved Disclaimer: The above is a matter of opinion provided for general information purposes only and is not intended as investment advice. Information and analysis above are derived from sources and utilising methods believed to be reliable, but we cannot accept responsibility for any losses you may incur as a result of this analysis. Individuals should consult with their personal financial advisors.
© 2005-2022 http://www.MarketOracle.co.uk - The Market Oracle is a FREE Daily Financial Markets Analysis & Forecasting online publication.