


Did the Stock Market Just Make the Mother of All Bull Traps?
Stock-Markets / Stock Markets 2019 Jun 02, 2019 - 06:29 PM GMTBy: Troy_Bombardia

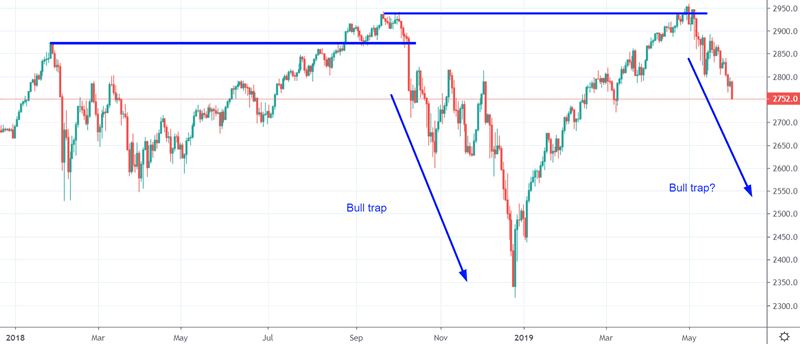
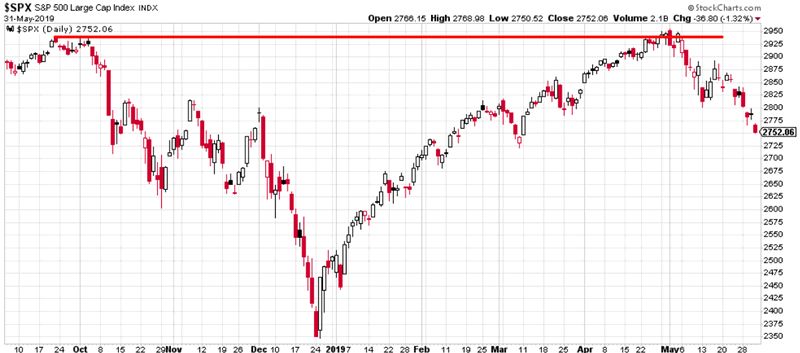
 The S&P is now down -6.5% from its all-time high, after making a marginal new high vs. its September 2018. On the charts, this “looks like” a bull trap. Is it really? Today’s headlines:
- Examining the “bull trap”
- Collapsing Treasury yields, and what this means for stocks
- SKEW’s decline
- Dow has fallen 6 weeks in a row
- Copper and stocks both down 4 weeks in a row
- First monthly decline after a 4 month rally
- Emerging markets outperforming the U.S.
Go here to understand our fundamentals-driven long term outlook. For reference, here’s the random probability of the U.S. stock market going up on any given day.

Bull trap
After briefly making a new all-time high, the S&P is now down -6.5%. This “looks” terrible on a chart, because it looks like a false breakout.
But is this actually bearish? Is it normal for the S&P to fall approximately -20%, make a marginal new high, and then immediately fall again?
Let’s look at similar historical cases over the past 50 years.
Here’s every case in which the S&P makes a -15% to -20% correction, makes a marginal new high of less than +4%, and then immediately falls more than -4%. Use daily CLOSE $
For reference, the current case saw the S&P fall -19.6%, make a 0.6% new high, and then fall -6.5%
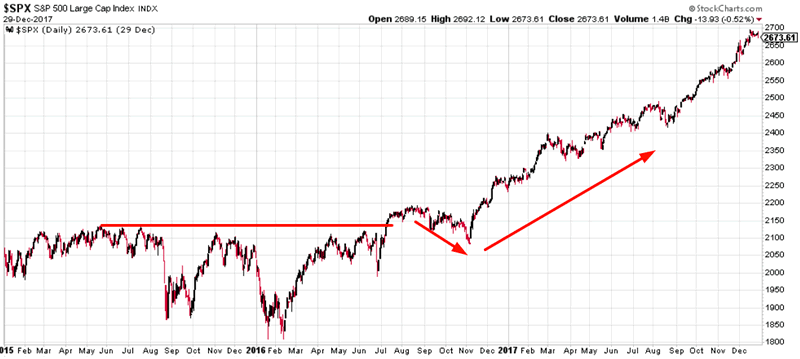
2015-2016
The S&P fell -14.16%, made +2.7% new high, and then fell -4.7%. Eventually the bull market resumed.
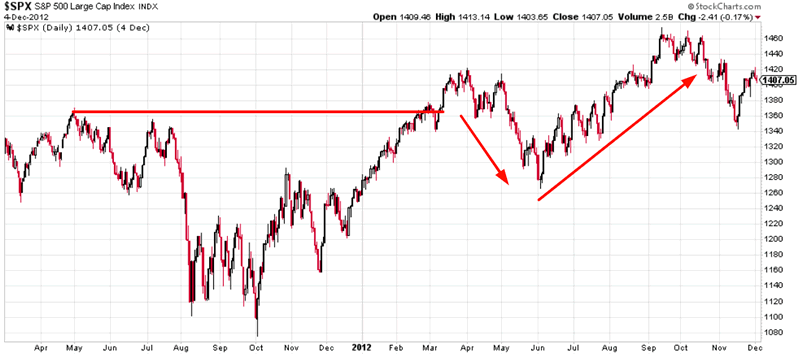
2011
The S&P fell -19.38%, made +4.06% new high, and then fell -9.92%. Eventually the bull market resumed.
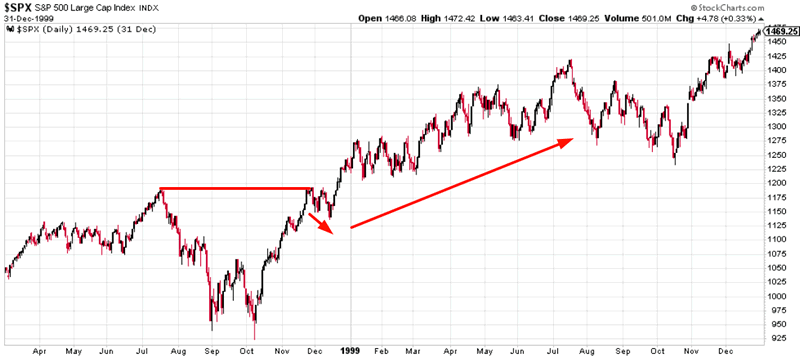
1998
The S&P fell -19.33%, made +0.4% new high, and then fell -4.22%. Eventually the bull market resumed.
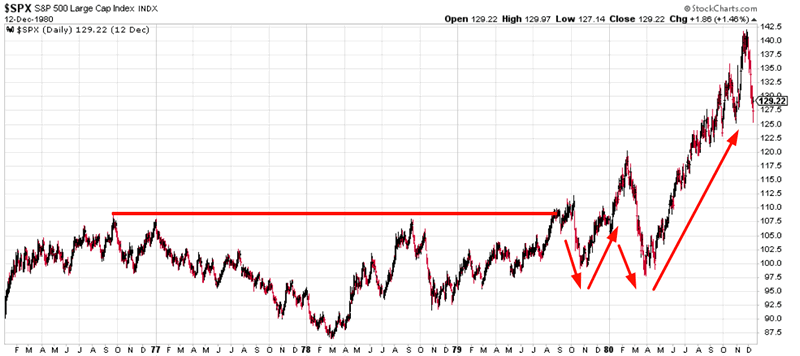
1976-1979
The S&P fell -19.41%, made +3.59% new high, and then fell -10.24%. Eventually the bull market resumed.
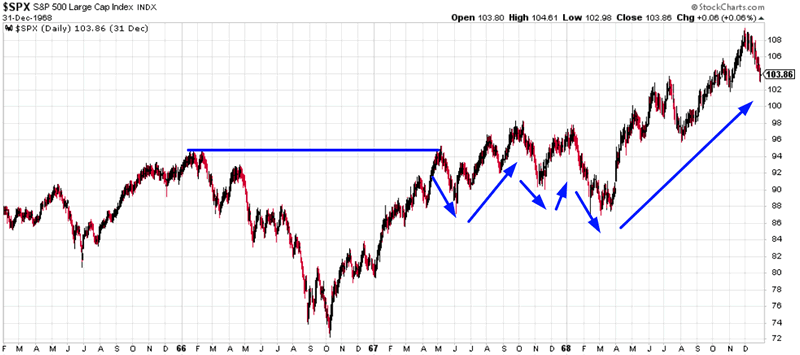
1966
The S&P fell -22.17%, made +0.55% new high, and then fell -6.5%. Eventually the bull market resumed, but did not last for long.
Conclusion
It is perfectly normal for the S&P to fall -15% to -20%, make a marginal new high, and then make a pullback/correction. The recent crash is fresh in investors’ minds, and with everyone thinking “is this just like the previous crash all over again”, their recency bias can become self-fulfilling.
Moreover, this is not usually how bull markets end. Bull markets don’t usually end with a massive -15% to -20% decline and then a marginal new high.
But MOST IMPORTANTLY, “bull traps” aren’t that reliable. They are only “bull traps” with 20/20 hindsight. In real-time, the probability that a bull trap will be the bull market’s top is a 50/50 coin toss.
Collapsing Treasury yields, and what this means for stocks
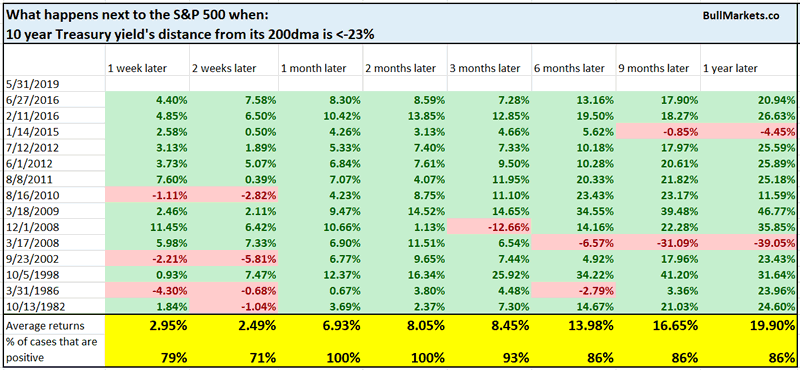
Treasury yields are falling along with the U.S. stock market. The 10 year Treasury yield is now more than -23% below its 200 day moving average (oversold).
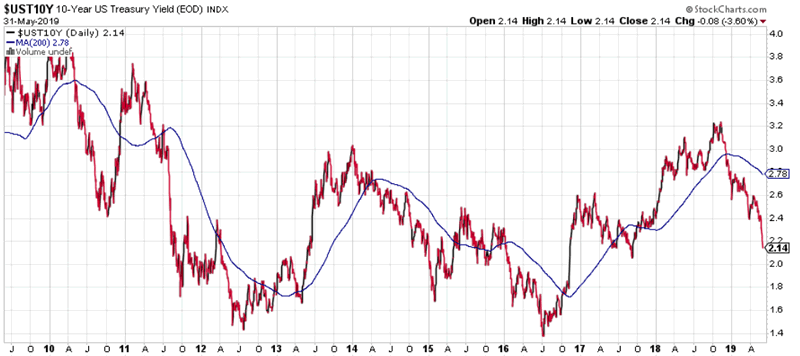
Here’s what happens next to the S&P when the 10 year yield is more than -23% below its 200 dma.
Here’s what happens next to the 10 year Treasury yield.
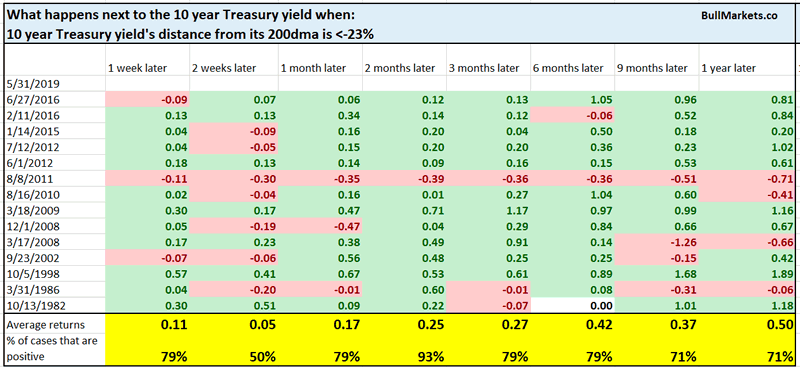
You can see that both stocks and interest rates tend to bounce 1-2 months later.
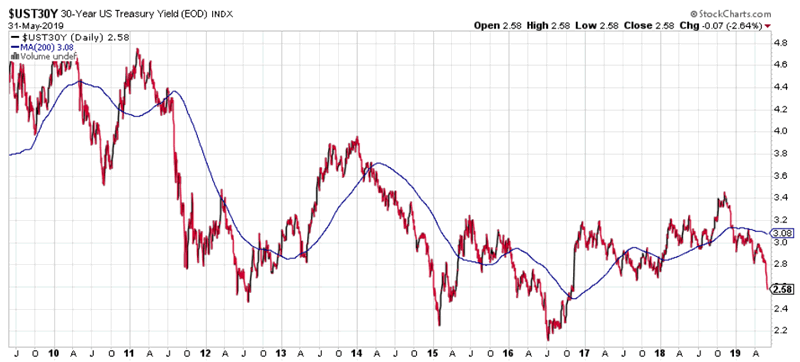
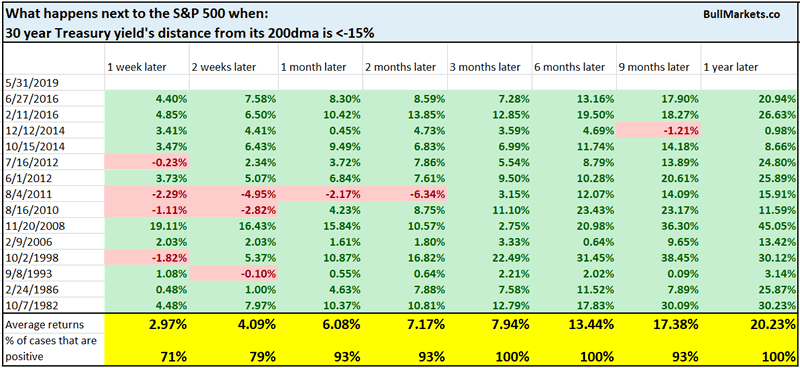
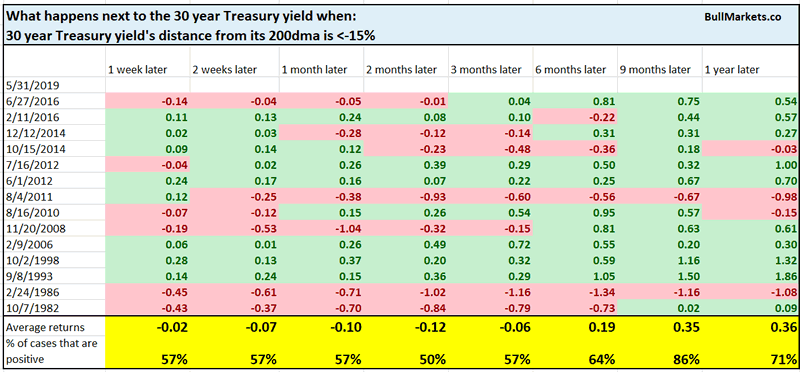
Similarly, the 30 year Treasury yield has also collapsed. It is now -15% below its 200 dma.
A collapse in the 30 year Treasury yield is mostly bullish for stocks, and bullish for the 30 year Treasury yield 9 months later.
SKEW
The SKEW Index measures financial risk. It tends to move inline with the S&P because:
- As the stock market rises, the probability of a decline/crash increases.
- As the stock market falls, the probability of a further decline/crash decreases.
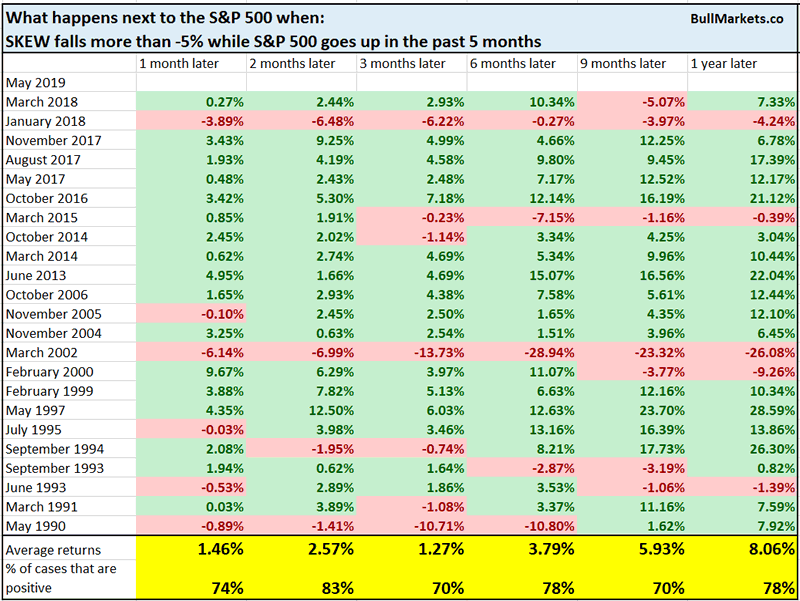
Whereas stocks have gone up over the past 5 months, SKEW has fallen.
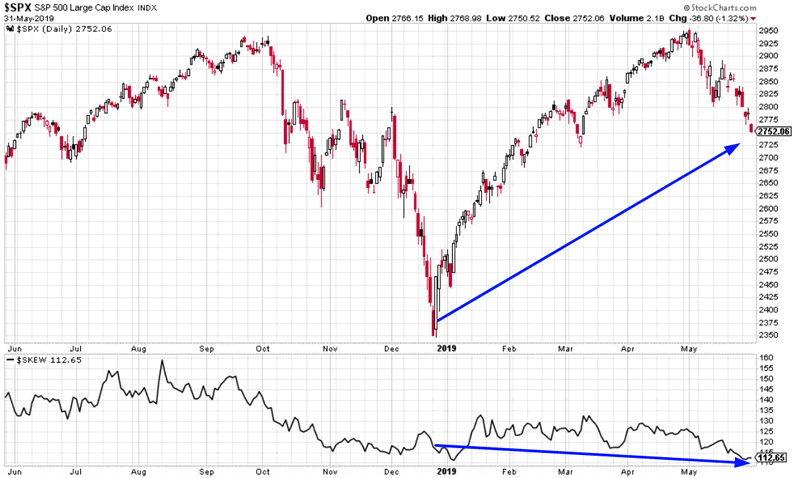
Such a divergence between the S&P and SKEW is mostly bullish for stocks 2 months later.
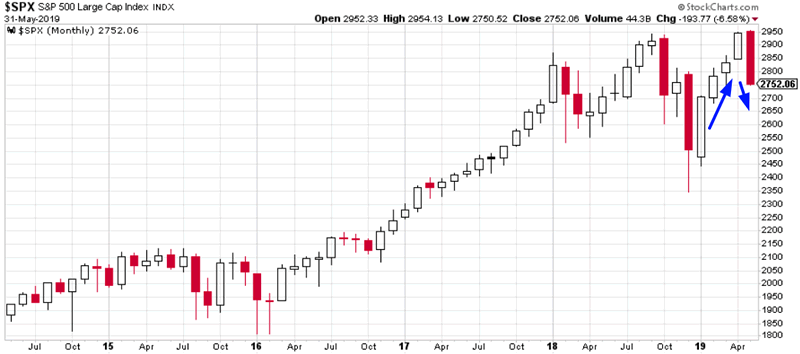
Dow falling 6 weeks in a row
The Dow has fallen 6 weeks in a row.
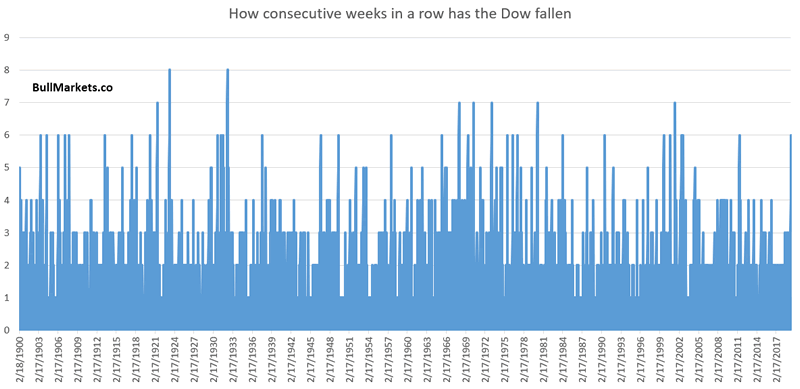
From 1900 – present, the Dow tends to go up next week 77% of the time.
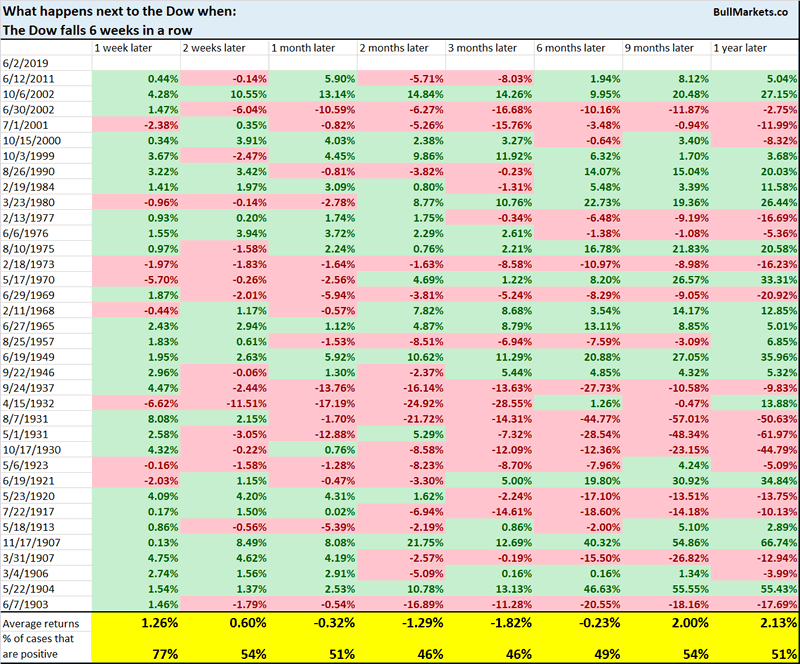
*The short term is always extremely unpredictable, no matter how much conviction you have. Trade war news only adds to this short term uncertainty.
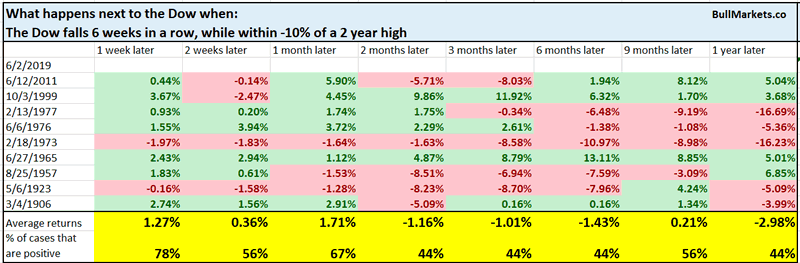
With that being said, what’s uncommon is that the Dow has fallen 6 weeks in a row while still within -10% of an all-time high. Most of these “down 6 weeks in a row” streaks happen AFTER the stock market is already in a bear market.
Historically, this is more bearish than random 6-12 months later.
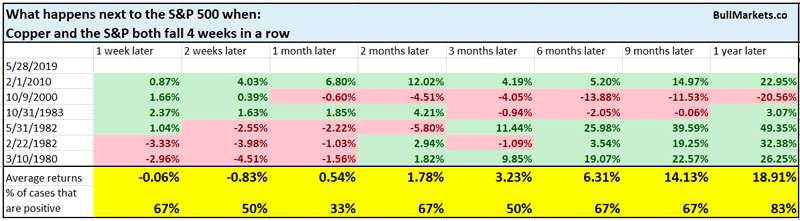
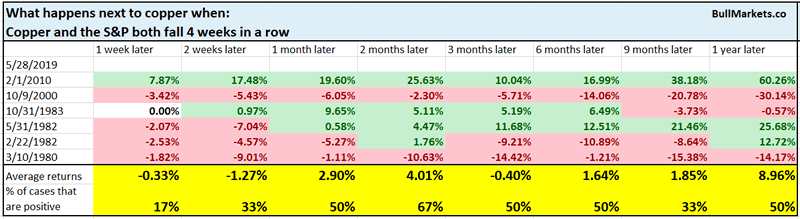
Copper and stocks both down 4 weeks in a row
Commodities and stocks are moving together right now. Both copper and the S&P have fallen 4 weeks in a row.
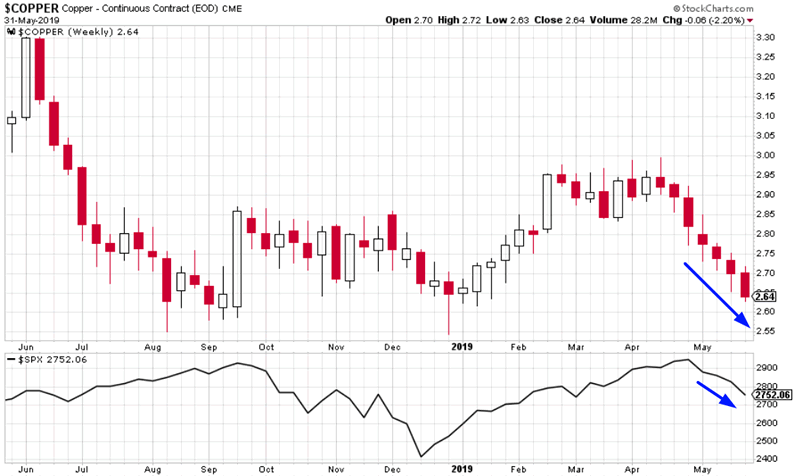
Historically, this combination of copper and stocks falling together is more bearish for copper than stocks.

First monthly decline
It’s important to put the recent stock market decline into context.
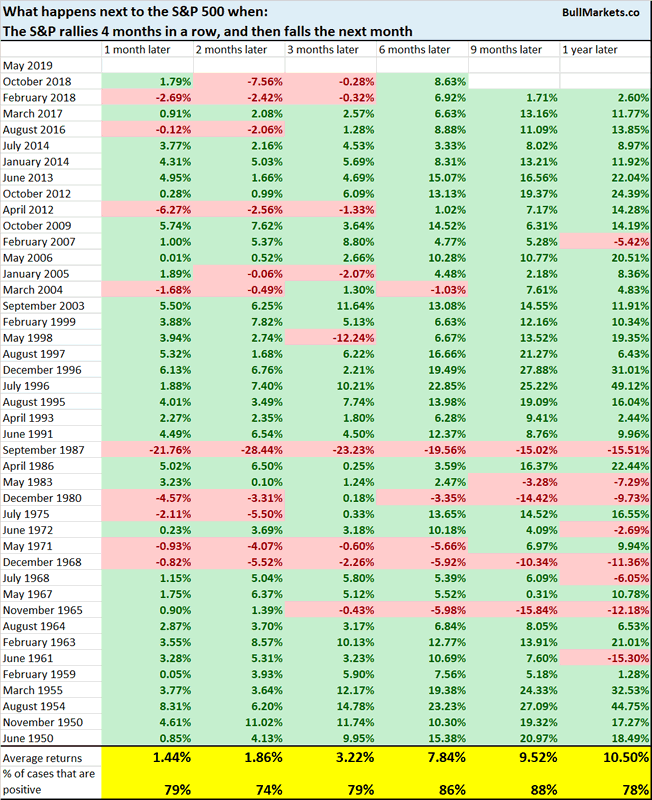
The S&P rallied 4 months in a row from January – April, and has now fallen in May.
Here’s what happens next to the S&P when it rallies 4 months in a row, and then falls during the 5th month.
Emerging markets
And lastly, here’s a quick look at emerging markets and China. While the U.S. stock market continues to fall, emerging markets and China haven’t fallen much more beyond their early-May plunge.
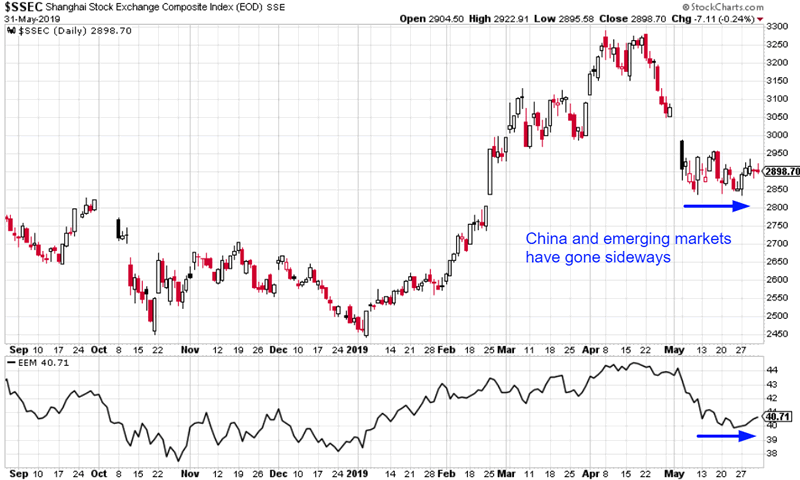
This probably has to do with the Chinese government’s massive injection of liquidity. You’ll notice that the same thing happened last year during the Q4 crash. U.S. stocks crashed, Chinese and emerging market stocks were mostly flat.
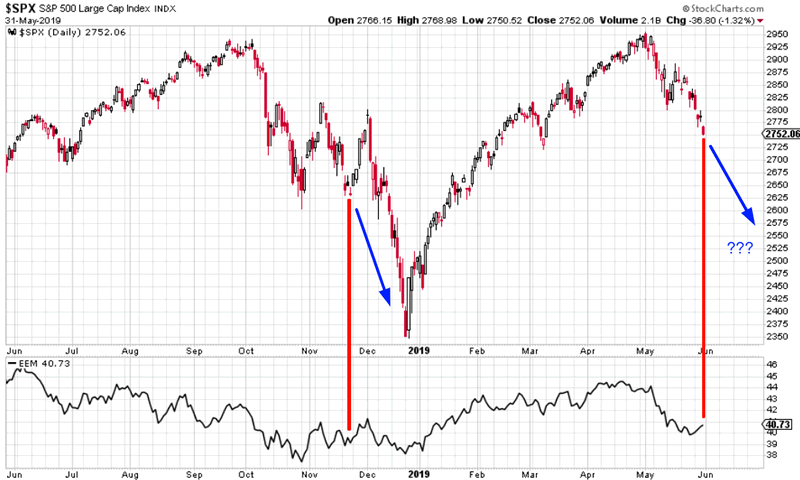
So does this mean that “it’s October-December 2018 all over again?”
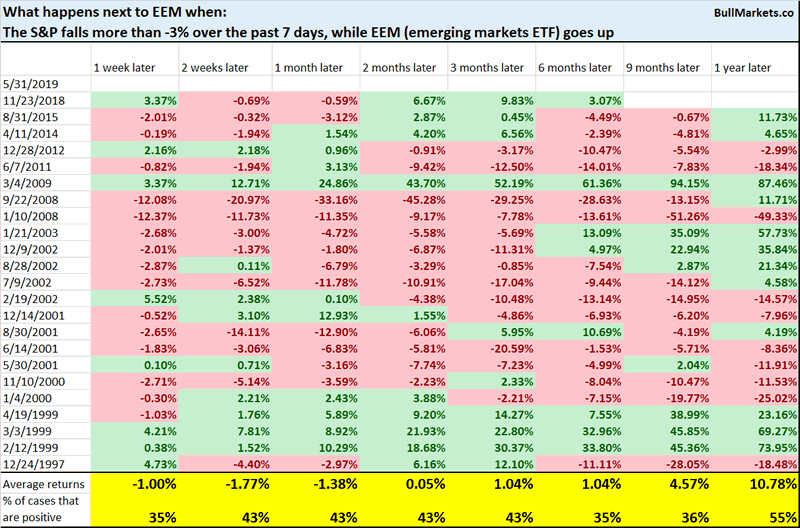
Here’s what happens next to the S&P when it falls more than -3% over the past 7 days, while EEM (emerging markets ETF) goes up.
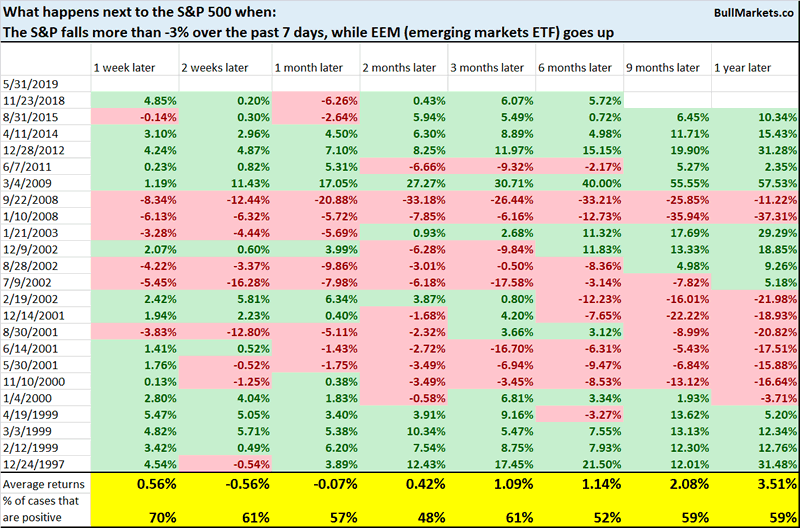
Slightly more bearish than random for the S&P on all-time frames.
However, this is usually worse for emerging markets.
We don’t use our discretionary outlook for trading. We use our quantitative trading models because they are end-to-end systems that tell you how to trade ALL THE TIME, even when our discretionary outlook is mixed. Members can see our model’s latest trades here updated in real-time.
Conclusion
Here is our discretionary market outlook:
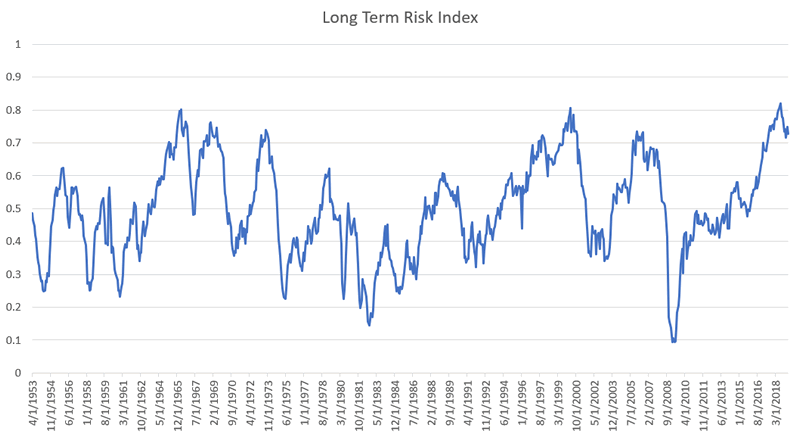
- The U.S. stock market’s long term risk:reward is not bullish. In a most optimistic scenario, the bull market probably has 1 year left.
- Most of the medium term market studies (e.g. next 6-12 months) are bullish, although a few of trend following studies are starting to become bearish.
- Market studies over the next 1-2 weeks are mixed (some bullish and some bearish). This indicates no clear edge right now. Trade war news only adds to this uncertainty.
- HOWEVER, our market studies for the next 1-3 months are starting to turn more bullish.
- We focus on the medium-long term.
Goldman Sachs’ Bull/Bear Indicator demonstrates that risk:reward does favor long term bears.
Click here for more market studies
By Troy Bombardia
I’m Troy Bombardia, the author behind BullMarkets.co. I used to run a hedge fund, but closed it due to a major health scare. I am now enjoying life and simply investing/trading my own account. I focus on long term performance and ignore short term performance.
Copyright 2019 © Troy Bombardia - All Rights Reserved
Disclaimer: The above is a matter of opinion provided for general information purposes only and is not intended as investment advice. Information and analysis above are derived from sources and utilising methods believed to be reliable, but we cannot accept responsibility for any losses you may incur as a result of this analysis. Individuals should consult with their personal financial advisors.
© 2005-2022 http://www.MarketOracle.co.uk - The Market Oracle is a FREE Daily Financial Markets Analysis & Forecasting online publication.