


Stock Market Major Index Top In 3 to 5 Weeks?
Stock-Markets / Stock Markets 2019 Jul 11, 2019 - 04:58 PM GMTBy: Chris_Vermeulen

 Our researchers rely on a number of proprietary tools and cycle forecasting technology. Additionally, we use custom index charts to help measure price cycles, trends, support & resistance and many other aspects of the markets. Recently, we posted an article relating to the US Dollar and foreign currencies using custom index techniques. In the past, we’ve highlighted our Custom Price Cycle index that we use to gauge market sentiment, topping and bottoming setups. All of these tools are essential for our team of researchers while they attempt to identify trade setups and larger market events.
Currently, we are highlighting a number of our custom index chart that suggest a market top may only be 3 to 5 weeks away and the setup of this market top may surprise many traders. We posted a good forecast chart here also.
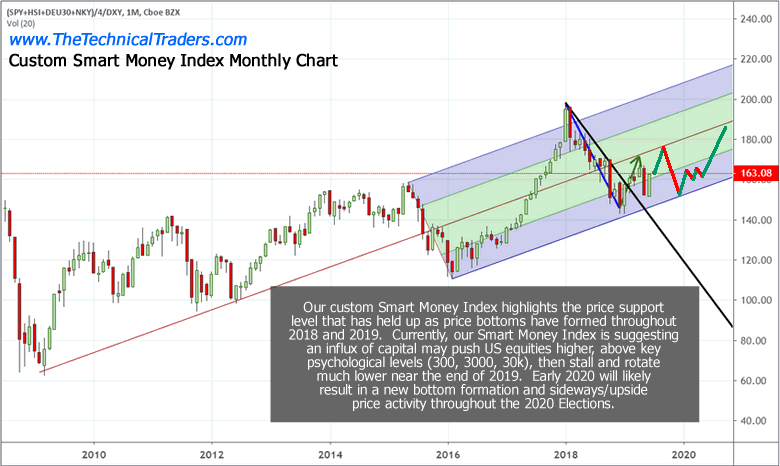
First, we’ll highlight our Smart Money Custom Index chart on a Monthly charting basis. As you can see since the ultimate price bottom in 2009, and using the price range from 2015 to 2016 (the rotation prior to the 2016 Presidential Elections) as the basis for the forward envelope, our Smart Money index shows the markets have rallied to levels just above the envelope in January 2018, then rotated lower to levels near the lower envelope levels in December 2018. This extended price rotation suggests the entire year of 2018 prompted a massive price rotation event that likely resulted in a price revaluation cycle.
Our researchers believe the strength of the US Dollar will continue to drive foreign investments into the US stock market and prompt a rally to levels near the middle of this price envelope before stalling and topping in August or September of 2019. This top formation should result in a price decline in the US stock market of at least 16% with a maximum decline level of somewhere between 24% to 28% overall. We’ll get into more detail about that later in this article.
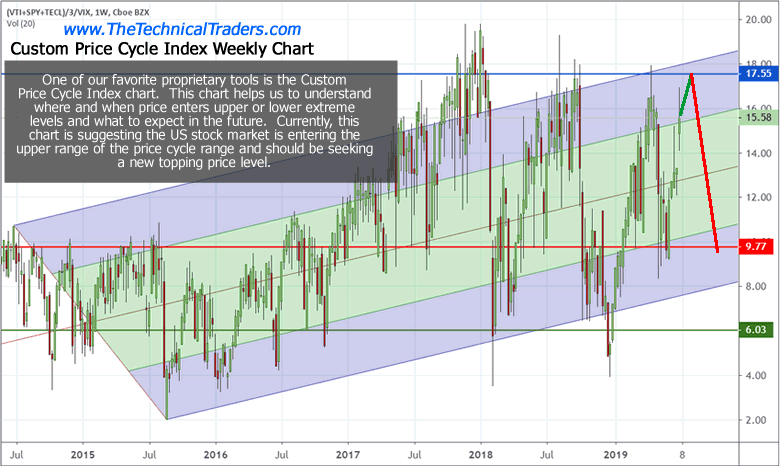
We want our readers to understand this Custom Price Cycle chart highlights the level at which the price bottom will likely form, near the lower level of the current price envelope, and suggests the current price rally will likely attempt to breach key psychological price levels ($300: SPY, $3000: ES, $30k: INDU) before this new price top completes.
After these new price highs are reached above the key psychological price levels, we believe the new price top will immediately begin to form with a short period of sideways price action, then a price decline back below these psychological levels and likely initiating a downward price decline of at least 11 to 13%. It is our opinion that this downward price decline in the US stock market will align with increased global market weakness and currency devaluations that are likely to be much greater in scale and scope than the US stock market price decline.
We believe the US Dollar will continue to stay strong while staying above $95~96 throughout most of this price decline. We believe the strength in the US Dollar may be a catalyst for the future global market price declines and may also play out in future activities in precious metals and commodities.
The strength of the US Dollar, while foreign markets are contracting, would present a very ominous event as debt, credit and future operational standards of many foreign corporations, nations, governments, and consumers could come under severe pressures.
This Custom Price Cycle chart, below, highlights the current price setup of the US stock market in relation to previous high and low points. The closer we come to the upper price channel, the more likely we are to see price setup and seek out a price top formation. Although, history has shown that price can move up to these upper levels and continue to trend in an upward price channel for many weeks and months. So, at some point in the future, we would expect to see this Custom Price Cycle chart revert back to 2017 type price activity where price continually attempts to stay near the upper price channel levels with very mild price rotations.
Currently, though, we believe the US stock market is only 3 to 5 weeks away from a major price topping formation and that the downside price move will likely result in a, roughly, -16% to -25% downside price rotation before the end of 2019. We believe US earnings will push this Custom Price Cycle chart to levels near or above the upper price channel level and that will drive the US Dollar higher as well as a shift in capital deployment prior to the end of September. The shift will be away from technology and mid-caps and into the safety of cash, metals and large-cap equities.
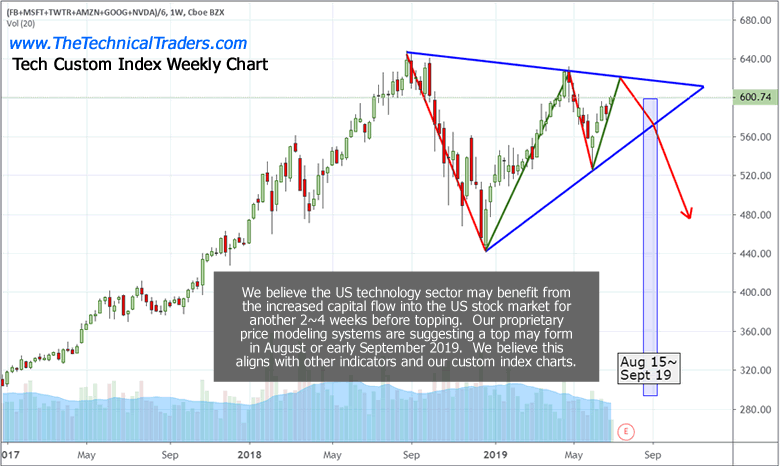
This shift in capital investments will likely transpire over many weeks before a serious price breakdown begins. In other words, we expect a top formation to setup somewhere between August 15 and September 16. This top formation will likely result in 3~6 weeks of sideways downward pricing pressure before a larger price breakdown happens. We believe the larger price breakdown will coincide with some external economic event and result in a migration of capital away from risk and into cash/metals/safety. Right now, our estimate is that this external economic event may be a currency devaluation event (Asian currencies breaking down and putting pressure throughout Europe and the rest of the developing world).
It is very likely that some issue related to the US/China trade deal prompts this currency devaluation move or that some extended credit/debt crisis event becomes more evident to investors. We believe the Asian currencies are particularly at risk for this event and that European and development market currencies will likely collapse as a result of the Asian/European currency price declines.
The US technology sector could be uniquely vulnerable should this event unfold as we suspect. Foreign markets and investor are heavily invested in the US technology sector. Many of these investors have moved their capital into the US Technology sector to avoid risks related to their home country’s currencies and to take advantage of the US Dollar strength. A decline in the US stock market, of any level greater than 10%, could send a shock-wave through the global markets and cause investors to shift away from risk and into safety.
Expect to see the volatility index to start rising and for the price of options to jump as well. I posted this VIX chart and cycle analysis a couple of days ago and its good for another few weeks in terms of its direction.
IN CONCLUSION:
Our researchers believe we are only a few weeks away from this event and those Q2 US earnings will push the US stock market above these psychological price levels. It is this event, the push above the key psychological price levels ($ 300: SPY, $ 3000: ES, $ 30k: INDU) that will likely trigger the topping event and set off a chain reaction event that we have described.
Pay very close attention to how the foreign currency market reacts over this time-span and pay very close attention to Gold/Silver and the US Dollar. We believe this topping price formation is going to unfold just as we are suggesting and we believe this will be an incredible opportunity for skilled technical traders.
We’ll keep you informed as this plays out with Wealth Building & Global Financial Reset Newsletter if you like what I offer, join me with the 1 or 2-year subscription to lock in the lowest rate possible and ride my coattails as I navigate these financial market and build wealth while others lose nearly everything they own during the next financial crisis. Join Now and Get a Free 1oz Silver Round or Gold Bar Shipped To You!
I can tell you that huge moves are about to start unfolding not only in metals, or stocks but globally and some of these super cycles are going to last years. A gentleman by the name of Brad Matheny goes into great detail with his simple to understand charts and guide about this. His financial market research is one of a kind and a real eye-opener. 2020 Cycles – The Greatest Opportunity Of Your Lifetime
As a technical analysis and trader since 1997, I have been through a few bull/bear market cycles. I believe I have a good pulse on the market and timing key turning points for both short-term swing trading and long-term investment capital. The opportunities are massive/life-changing if handled properly.
IM GIVING THEM AWAY WITH 2-YEAR MEMBERSHIPS
So kill two birds with one stone and subscribe for two years to get your FREE GOLD BAR and enough trades to profit through the next metals bull market and financial crisis!
SUBSCRIBE -> STACK GOLD BAR -> GET WINNING TRADES
Chris Vermeulen
www.TheTechnicalTraders.com
Chris Vermeulen has been involved in the markets since 1997 and is the founder of Technical Traders Ltd. He is an internationally recognized technical analyst, trader, and is the author of the book: 7 Steps to Win With Logic
Through years of research, trading and helping individual traders around the world. He learned that many traders have great trading ideas, but they lack one thing, they struggle to execute trades in a systematic way for consistent results. Chris helps educate traders with a three-hour video course that can change your trading results for the better.
His mission is to help his clients boost their trading performance while reducing market exposure and portfolio volatility.
He is a regular speaker on HoweStreet.com, and the FinancialSurvivorNetwork radio shows. Chris was also featured on the cover of AmalgaTrader Magazine, and contributes articles to several leading financial hubs like MarketOracle.co.uk
Disclaimer: Nothing in this report should be construed as a solicitation to buy or sell any securities mentioned. Technical Traders Ltd., its owners and the author of this report are not registered broker-dealers or financial advisors. Before investing in any securities, you should consult with your financial advisor and a registered broker-dealer. Never make an investment based solely on what you read in an online or printed report, including this report, especially if the investment involves a small, thinly-traded company that isn’t well known. Technical Traders Ltd. and the author of this report has been paid by Cardiff Energy Corp. In addition, the author owns shares of Cardiff Energy Corp. and would also benefit from volume and price appreciation of its stock. The information provided here within should not be construed as a financial analysis but rather as an advertisement. The author’s views and opinions regarding the companies featured in reports are his own views and are based on information that he has researched independently and has received, which the author assumes to be reliable. Technical Traders Ltd. and the author of this report do not guarantee the accuracy, completeness, or usefulness of any content of this report, nor its fitness for any particular purpose. Lastly, the author does not guarantee that any of the companies mentioned in the reports will perform as expected, and any comparisons made to other companies may not be valid or come into effect.
Chris Vermeulen Archive |
© 2005-2022 http://www.MarketOracle.co.uk - The Market Oracle is a FREE Daily Financial Markets Analysis & Forecasting online publication.