


Stock Market New Lows and Institutional Selling Trend Indicators
Stock-Markets / US Stock Markets Sep 30, 2008 - 02:07 AM GMTBy: Marty_Chenard

 Many of you remember this past July when I reported about the existing banking risk to your family and yourself. Back then, I noted that Cindy and I had closed all our accounts at Wachovia and went to a sound local bank. We knew we wanted to exit Wachovia and we knew which local bank we wanted because we obtained the VERIBANC REPORTS.
This morning, Wachovia is no more ... Citigroup is going to acquire Wachovia's banking operations. This deal was facilitated by the FDIC which has Citigroup taking on $42 billion of Wachovia losses and with the FDIC assuming the remaining losses. In spite of having to do this rescue, the FDIC is asserting that Wachovia didn't fail, and that all depositors are protected and there will be no cost to the Deposit Insurance Fund.
What? They didn't essentially fail? Surely they could put a more honest spin on it than this after having to eat all of those losses. We still maintain our recommendation: Check the safety of your bank and find another safe bank if necessary.
If you are looking for the September 15th. link on how to do this, here is the link: http://www.stocktiming.com/Banking_Crisis/Banking_Crisis_Alert_Warning-2.htm
Let's get back to the stock market ...
We will look at two important charts this morning ...
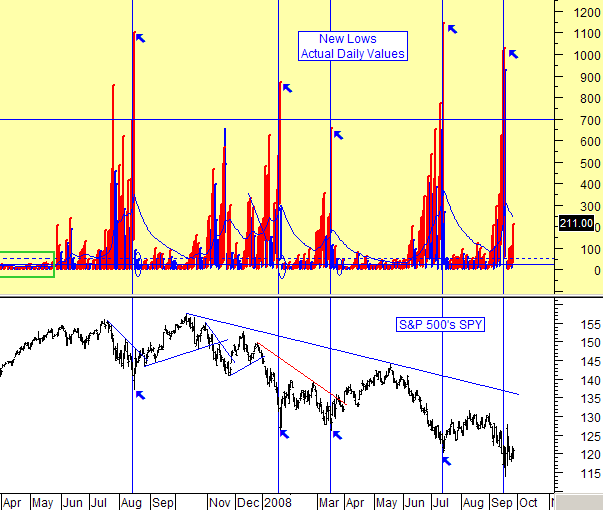
First, we will look at what is happening to the New Lows on the New York Stock Exchange. Take a quick look at today's chart and you will see a direct correlation between market drops and the rising level of New Lows. The safer times, where the markets have good rallies, have New Low levels at 28 or less.
Last week's levels were over 100. Friday's level turned out to be the worse when New Lows jumped up to 211.
Don't get too excited about the proposed Bail Out Plan because so far, the market is NOT impressed with it. See the next chart ...
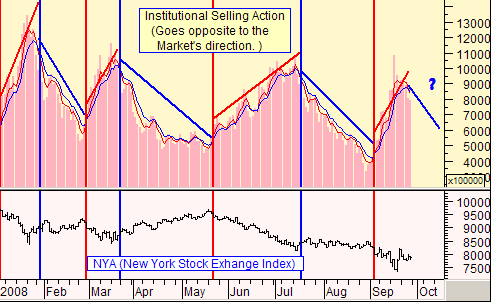
This next chart is a "courtesy look' at one of the daily charts posted on our paid subscriber site.
This chart monitors the amount of Institutional Selling. You already know that this is important because Institutional Investors are responsible for over 50% of the market's volume. Going against Institutional actions is a low odds game .
On this chart, you can see that when Institutions increased their selling, the market went down. When they decreased their selling, the market either went up or sideways. The key as to whether it went up or sideways has to do with another chart (not shown) that shows the trend and amount of Institutional Buying. It turns out that the differential amount between the Selling and Buying "spread" is the key as to whether we get a trading range or upside rally when the Selling trend is going down.
Right now, if the Institutional Selling confirms a down trend with today moving lower, then Institutional Investors will be "taking off" the downside pressure in the market. That will allow smaller investors to bid the market up. The key will then be if Institutions are ALSO buying or just allowing the market to be bid up so they can sell into it.
______________________________________________________________________
*** Feel free to share this page with others by using the "Send this Page to a Friend" link below.
By Marty Chenard
http://www.stocktiming.com/
Please Note: We do not issue Buy or Sell timing recommendations on these Free daily update pages . I hope you understand, that in fairness, our Buy/Sell recommendations and advanced market Models are only available to our paid subscribers on a password required basis. Membership information
Marty Chenard is the Author and Teacher of two Seminar Courses on "Advanced Technical Analysis Investing", Mr. Chenard has been investing for over 30 years. In 2001 when the NASDAQ dropped 24.5%, his personal investment performance for the year was a gain of 57.428%. He is an Advanced Stock Market Technical Analyst that has developed his own proprietary analytical tools. As a result, he was out of the market two weeks before the 1987 Crash in the most recent Bear Market he faxed his Members in March 2000 telling them all to SELL. He is an advanced technical analyst and not an investment advisor, nor a securities broker.
Marty Chenard Archive |
© 2005-2022 http://www.MarketOracle.co.uk - The Market Oracle is a FREE Daily Financial Markets Analysis & Forecasting online publication.