


UK House Building and Population Growth Analysis
Housing-Market / UK Housing Jul 17, 2019 - 12:22 PM GMTBy: Nadeem_Walayat

Part1 (UK House Building 20 Years Shortfall). The below graph shows the UK annual population change against annual new housing build completions accompanied by annual net migration.
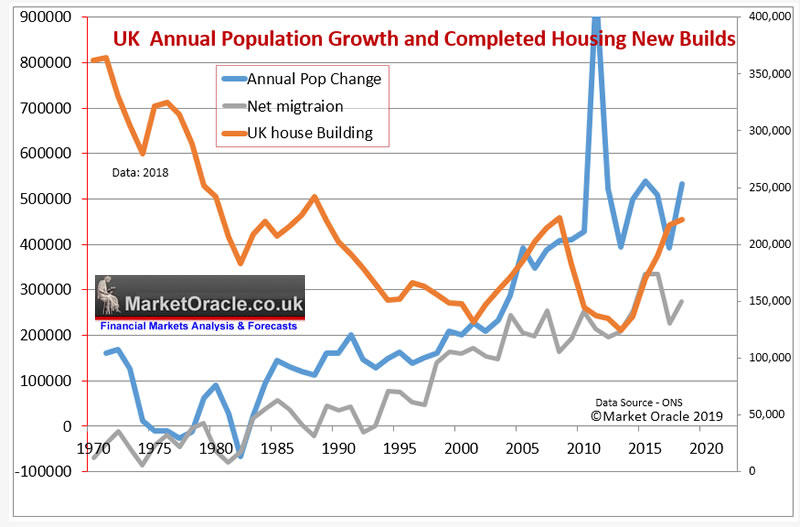
The graph illustrates a major long-term shift took place in UK housing market dynamics by the year 2000 as the annual change in UK population started to surge higher well beyond the normal dynamics of the system that had typically seen average population growth of about 100k per annum, capped at 200k per annum. Instead population growth soared far beyond the number of new house builds that ended the preceding trend for home construction to exceed population growth demands as the rate if house building fell from 364k per annum in 1970 to just 132k by 2000. Whilst at the same time the average size of the UK household had continued to shrink by falling from 3.1 in 1960 to just 2.23 in 2016 (one of the lowest in the world) as a consequence of the increase in single person households and single parent families. This ratio is only trending in one direction i.e. lower which means that even if the UK population suddenly stopped increasing then the falling ratio towards 2.15 by 2030 would imply demand for at least an EXTRA 1 million properties!
So by 2000 Britain was primed for the catastrophic consequences of a. under construction of new homes and b. a population explosion as a consequence of Tony Blair's Labour government opening the flood gates to allow millions of eastern European economic migrants to enter without consequences to the impact on the infrastructure which resulted in net migration soaring from 50k per annum of the 1990's to a peak of 336k just prior to the 2016 EU referendum totaling some 4 million extra people to house.
And thus the twin forces of out of control immigration and under construction of new homes resulted in a worsening housing crisis that prompted the people of Britain to vote to LEAVE the European Union as Britain had gone from building over 200,000 homes per annum with net migration of less than 50k, a population increase of 100k per annum to building as few as 130,000 homes, with net migration of 250k+ with population growth of over 500,000 per annum and this IS why Britain voted to LEAVE the EU, a housing crisis some 16 years in the making for which the primary blame lies with Tony Blair's government.
The following is one of my custom UK housing market graphs that more clearly illustrates the degree of housing market crisis that Britain finds itself in as a ratio between the accumulative change in population since 1970 against the accumulative number of new completed house builds also since 1970 which shows the magnitude of the trend towards the over crowding of Britain's housing market that given recent mainstream press headlines based on academic studies clearly remain largely blind to the consequences of, because they still are unable to visualise the magnitude of Britain's housing crisis that has WORSENED since Britain voted to LEAVE the EU which should act as a warning to those who contemplate holding a second EU referendum, as it implies LEAVE could win by an even bigger margin next time!
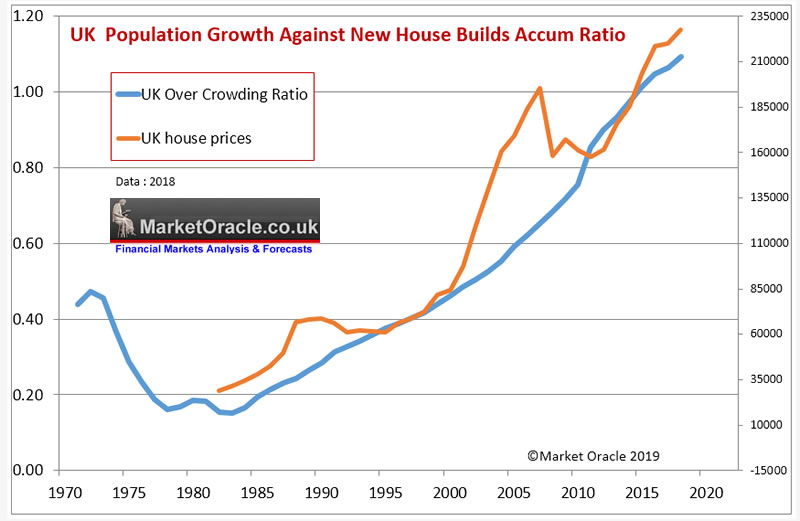
The ratio illustrates the change in trend that started to take place during the mid 1980's that coincided with the Thatcher governments reversal of the policy for the construction of social housing and implementation of the right to buy scheme that resulted in the sale of millions of socially owned local council housing whilst at the same time putting restrictions on the the construction of new social housing.
Now these Thatcherite measures were not just adopted out of spite for socialism, but instead was clearly as a result of academic government advisors looking in the rear view mirror at what had happened during the 1970's, namely the mass exodus of millions of Brit's who become economic migrants populating mainly North America and Australia and thus the over supply of UK housing.
This lack of insight of what was going to happen next laid the seeds for the property boom of the nineties as house prices responded to the lack of supply to meet new demand that has persisted since the mid 1980's. With Tony Blair's Labour government exacerbating the trend for the inability of supply to keep pace with population growth which ensured continuously persistent upward pressure on UK house prices that despite the great recession o 2008-2009 still showed an accelerating trend as new build supply that currently stands at 220k per year is set against government estimates for a requirement of at 300k per year, with 350k being a more realistic estimate to meet demand given the trend for falling household size, which thus ensures that the UK's over crowding crisis just keeps worsening with each passing year just as it has done or the past 20 years!
Remember the graph is a ratio of how over crowded Britain is, having gone from a ratio of 0.46 in 2000, when perhaps housing was largely affordable for Britain's hard working families with average house prices at £80k. To today's ratio of 1.09 (2018) that is worse than the previous years (1.06) and thus average house prices are now £227k!
So I hope you now fully understand the true nature of Britains housing crisis and what the journalists and academics fail to see, hence their doom and gloom housing market crash is always coming headline stories in the mainstream press.
And this analysis does not even consider the fact that each year the total number of properties remaining empty continues to rise either as a consequence of being up for sale, let, legal issues or falling derelict. This total is now more than 1 million empty properties at any one time, a number which despite demand looks set to continue to rise as many of the derelict buildings will only come back on the market when they have been demolished and rebuilt, so erroneously counted as new builds when they should be classed as rebuilds.
Implications for UK House Prices
The rest of this analysis has first been made available to Patrons who support my work: UK House Building and House Prices Trend Forecast
So for immediate First Access to ALL of my analysis and trend forecasts then do consider becoming a Patron by supporting my work for just $3 per month. https://www.patreon.com/Nadeem_Walayat.
So for First Access to ALL of my analysis and trend forecasts then do consider becoming a Patron by supporting my work for just $3 per month. https://www.patreon.com/Nadeem_Walayat.
Scheduled Analysis :
- Gold and Silver Trend Analysis Update
- China Stock Market SSEC
- NASDAQ
- EuroDollar Futures
- Bitcoin Update
- UK Housing market series
- Machine Intelligence Investing stocks sub sector analysis
- EUR/RUB
- Investing to Profit and Benefit from Human Life Extension AI Stocks and Technologies
- Silver Investing Trend Analysis and Price Forecast 2019
- Next British Prime Minister Tory Leadership Betfair Betting Markets
- Gold Price Trend Forecast Summer 2019
- Stock Market US China Trade War Panic! Trend Forecast May 2019 Update
- US House Prices Trend Forecast 2019 to 2021
- Bitcoin Price Trend Forecast 2019 Update
- Top 10 AI Stocks for Investing to Profit from the Machine Intelligence Mega-trend
And ensure you are subscribed to my FREE Newsletter to get my public analysis in your email in box (only requirement is an email address).
Your analyst
Nadeem Walayat
Copyright © 2005-2019 Marketoracle.co.uk (Market Oracle Ltd). All rights reserved.
Nadeem Walayat has over 30 years experience of trading derivatives, portfolio management and analysing the financial markets, including one of few who both anticipated and Beat the 1987 Crash. Nadeem's forward looking analysis focuses on UK inflation, economy, interest rates and housing market. He is the author of five ebook's in the The Inflation Mega-Trend and Stocks Stealth Bull Market series that can be downloaded for Free.


 Nadeem is the Editor of The Market Oracle, a FREE Daily Financial Markets Analysis & Forecasting online publication that presents in-depth analysis from over 1000 experienced analysts on a range of views of the probable direction of the financial markets, thus enabling our readers to arrive at an informed opinion on future market direction. http://www.marketoracle.co.uk
Disclaimer: The above is a matter of opinion provided for general information purposes only and is not intended as investment advice. Information and analysis above are derived from sources and utilising methods believed to be reliable, but we cannot accept responsibility for any trading losses you may incur as a result of this analysis. Individuals should consult with their personal financial advisors before engaging in any trading activities.
Nadeem Walayat Archive |
© 2005-2022 http://www.MarketOracle.co.uk - The Market Oracle is a FREE Daily Financial Markets Analysis & Forecasting online publication.