


Silver Price Target during the Next Bull Market
Commodities / Gold & Silver 2019 Jul 25, 2019 - 07:04 PM GMTBy: Chris_Vermeulen

 It is time to explore the details of our Gold vs. Silver ratio research and to start to understand the potential for profits within this move in precious metals. The first part of our research article highlighted the Gold vs. Silver ratio and why we believe the “reversion process” that is taking place in price could be an incredible opportunity for traders.
Historically, when the Gold vs. Silver ratio reaches an extreme level, and precious metals begin to rally, a reversion within the ratio takes place, which represents a revaluation process for silver prices compared to gold prices. This typically means that the prices of Silver will accelerate to the upside as the price of gold moves higher – resulting in a decrease in the ratio level.
This reversion process related to precious metals pricing is an opportunity for traders to take advantage of an increased pricing advantage to generate profits.
For every drop of 5.0 points in the gold/silver ratio, the price of Silver should increase by 6.5% to 7.5% to the price of Gold.
This research is based on our belief that Gold and Silver will continue to rally and potentially enter a parabolic upside price advance soon. If this takes place and precious metals begin to skyrocket higher, the ratio level will react in a hyperactive “reversion process” where Silver may move higher at a rate that is substantially faster than Gold. This is the process that we are exploring and our researchers are attempting to shed some insight into this event.
I believe a reversion process has already begun to take place within the precious metals market. We believe this reversion process is about to explode as a dramatic revaluation event unfolds over the next 12+ months. This process will become more evident to traders as the price of Gold continues to rally towards the $1750+ level and as the price of Silver explodes higher in larger and larger advances.
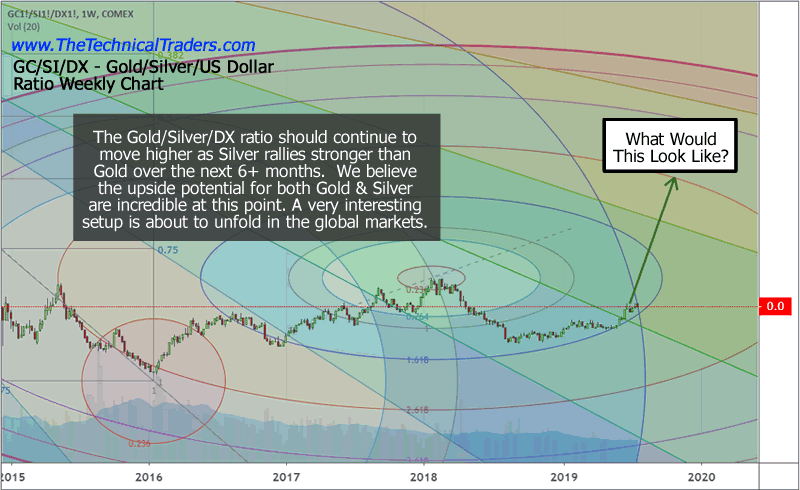
Gold/Silver/US Dollar ratio chart
This Gold/Silver/US Dollar ratio chart is the basis of our analysis for the reversion process event and the associated revaluation event. Our previous analysis suggests Gold will attempt a move to levels above $1650 to $1700 on the next breakout move higher. This next upside price move will expose the price reversion event for all traders to witness and we have mapped out the expected Silver price advantage for all traders going forward.
Gold/Silver Ratio – Silver Price vs Ratio Level
We put together this reference table to assist all traders in understanding just how important this move could be to them. This reference table shows the current Gold/Silver price levels (in GREY) as the ratio levels change from 88 to lower levels.
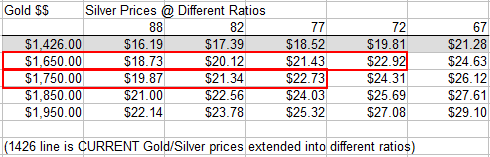
If the price of Gold were to stay at the same $1426 level while Silver rallied to prompt an 82 or 77 ratio level, the price of silver would move from the current price of $16.19 to $17.39 or $18.52 in order to reflect this decreased ratio level. That represents a 7.5% to 14.3% price increase.
Yet if the price of Gold advances to $1650 or $1750 while the ratio level drops to the 82 or 77 ratio level (because Silver advances fast than Gold), then the price of Silver would move from the current price of $16.19 to $20.12 to $22.73. That move represents a 24.2% to 40.3% price increase in Silver when Gold increased only 15.7% to 22.7%.
What If Silver Advances Quicker Than Gold?
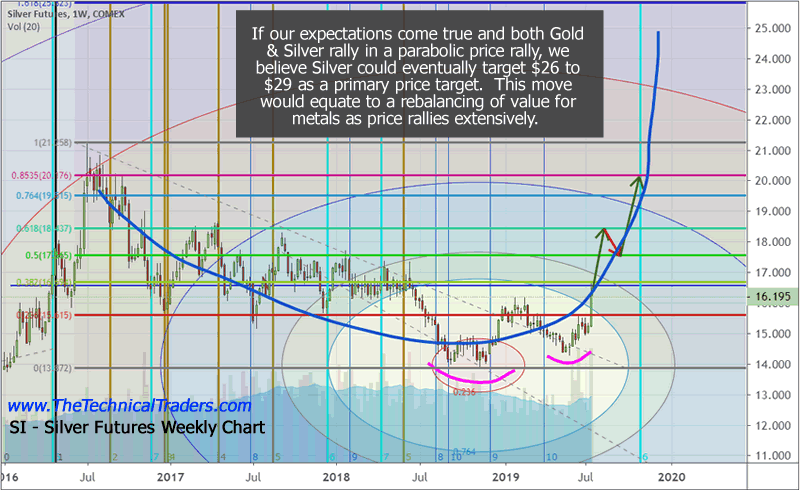
If Silver advances even faster than our “what if” scenario, above, and Gold continues to advance as we expect, the increased price reversion process taking place in Silver as a process of this revaluation event could result in a 70% to 110% fast price advance in Silver than the price advance that takes place in Gold.
We believe the next upside price leg in Silver will target $19.50 to $22.75. This target range supports the highlighted area on our Ratio table (below). In other words, we believe the ratio level will attempt to quickly move toward the 70 to 77 level as Gold prices rally over the next few months. This would push silver up into the $22.50 to $25 price level very quickly.
What If Gold Rallies Faster Than Silver?
If Gold were to rally above $1950 on an extended upside price advance before August or September, we believe the reversion process would become extremely hyperactive in nature and the price of Silver could push well above $29~34 per ounce – may be even higher.
This declining ratio level acts as a turbo-boost for the price of Silver as Gold continues to advance. The recent rotation to the downside suggests the ratio relationship between Gold and Silver has already stated a reversion process – the only question is “where will it end?”. Our researchers believe it will stop where it stops and we believe the 65 level on the Ratio chart is just the initial target for this first upside leg.
Imagine where Silver could go if the ratio level fell to levels below 40 and gold rallied to $2500 or more? Ok, stop imagining and take a look at this second extended ratio table.
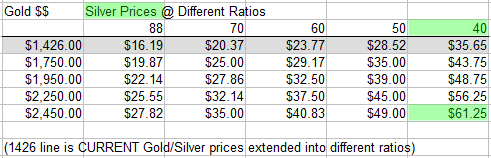
Pay attention to the fact that Silver could rally more than 300% if Gold moves up above $1750 and the Gold/Silver ratio drops below the 55 level. If Gold were to continue to rally and the Gold/Silver ratio continued to fall, Silver could rally well above $50 over the long run.
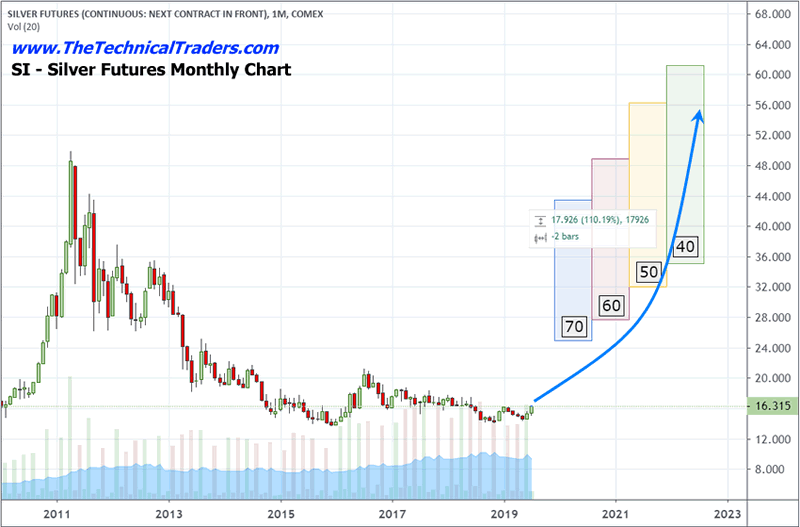
Silver Price Range As Gold/Silver Ratio Move To the Average
We’ve attempted to graph the ranges of the expected move in Silver into segments based on the Gold/Silver ratio to assist traders in understanding just how powerful this setup really is. Imagine what it would take for Gold to move up to levels above $1750 (which is our expected target for the next leg higher) and for Silver to rally into the 55 to 65 ratio level. If that happens, the expected target price for Silver would be somewhere between $30 and $40 – more than 100% higher than the current price of Silver.
If you think $50 is unimaginable or unrealistic, we’ve just shown you why it is possible these levels could be reached before the end of 2019 or in 2020. If you have not grasped the reality of what is likely to unfold over the next 6 to 12+ months in the global markets and that precious metals are the setup of the decade, then pay attention to the fact that gold and silver are poised for moves ranging from 40% to 240% over the next 12+ months depending on the scale and scope of this move.
Our current objectives for the ratio levels are still 55 to 65 within this next move higher where Gold will target $1750. Beyond that level, we’ll have to update you as the price continues to explore new highs.
CONCLUDING THOUGHTS:
In short, don’t miss the trade of the decade. These opportunities for skilled technical traders over the next 16+ months is incredible. Huge price swings, incredible trends, big rotations and we could see nearly 300%+ profits to be had if you know what to trade and when. These types of opportunities are perfect for skilled technical traders like us and we want to help you prepare for and trade these opportunities.
This bear market for stocks and the new bull market for metals has been a long time coming, but finally, almost all the signs are showing that it’s about to start. As a technical analyst since 1997 having lost a fortune and making a fortune from bull and bear markets I have a good understanding of how to best attack the market during its various stages.
Be prepared for these incredible price swings before they happen and learn how you can identify and trade these fantastic trading opportunities in 2019, 2020, and beyond with our Wealth Building & Global Financial Reset Newsletter. You won’t want to miss this big move, folks. As you can see from our research, everything has been setting up for this move for many months – most traders/investors have simply not been looking for it.
Join me with a 1 or 2-year subscription to lock in the lowest rate possible and ride my coattails as I navigate these financial market and build wealth while others lose nearly everything they own during the next financial crisis.
As a technical analysis and trader since 1997, I have been through a few bull/bear market cycles. I believe I have a good pulse on the market and timing key turning points for both short-term swing trading and long-term investment capital. The opportunities are massive/life-changing if handled properly.
FREE GOLD & SILVER WITH MEMBERSHIPS
So kill two birds with one stone and subscribe for two years to get your FREE PRECIOUS METAL and get enough trades to profit through the next metals bull market and financial crisis!
Chris Vermeulen
www.TheTechnicalTraders.com
Chris Vermeulen has been involved in the markets since 1997 and is the founder of Technical Traders Ltd. He is an internationally recognized technical analyst, trader, and is the author of the book: 7 Steps to Win With Logic
Through years of research, trading and helping individual traders around the world. He learned that many traders have great trading ideas, but they lack one thing, they struggle to execute trades in a systematic way for consistent results. Chris helps educate traders with a three-hour video course that can change your trading results for the better.
His mission is to help his clients boost their trading performance while reducing market exposure and portfolio volatility.
He is a regular speaker on HoweStreet.com, and the FinancialSurvivorNetwork radio shows. Chris was also featured on the cover of AmalgaTrader Magazine, and contributes articles to several leading financial hubs like MarketOracle.co.uk
Disclaimer: Nothing in this report should be construed as a solicitation to buy or sell any securities mentioned. Technical Traders Ltd., its owners and the author of this report are not registered broker-dealers or financial advisors. Before investing in any securities, you should consult with your financial advisor and a registered broker-dealer. Never make an investment based solely on what you read in an online or printed report, including this report, especially if the investment involves a small, thinly-traded company that isn’t well known. Technical Traders Ltd. and the author of this report has been paid by Cardiff Energy Corp. In addition, the author owns shares of Cardiff Energy Corp. and would also benefit from volume and price appreciation of its stock. The information provided here within should not be construed as a financial analysis but rather as an advertisement. The author’s views and opinions regarding the companies featured in reports are his own views and are based on information that he has researched independently and has received, which the author assumes to be reliable. Technical Traders Ltd. and the author of this report do not guarantee the accuracy, completeness, or usefulness of any content of this report, nor its fitness for any particular purpose. Lastly, the author does not guarantee that any of the companies mentioned in the reports will perform as expected, and any comparisons made to other companies may not be valid or come into effect.
Chris Vermeulen Archive |
© 2005-2022 http://www.MarketOracle.co.uk - The Market Oracle is a FREE Daily Financial Markets Analysis & Forecasting online publication.