


Palladium Collapses After Double-Top From Early July 2019
Commodities / Palladium Aug 04, 2019 - 02:04 PM GMTBy: Chris_Vermeulen

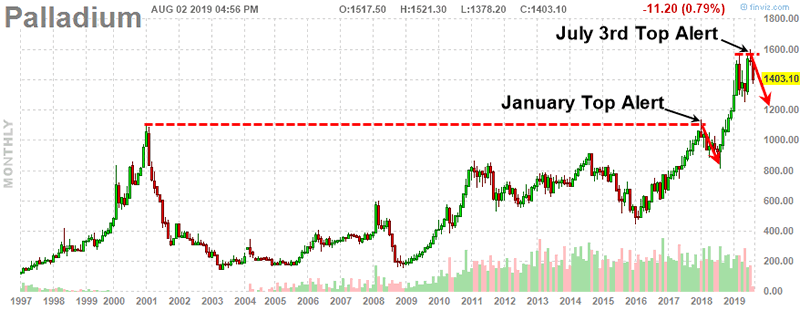
 It was almost like Palladium traders followed our research to the letter when the trend reversed on July 11, 2019. Our research team issued a report indicating a Double-Top pattern was setting up in Palladium on July 3, 2019. At that time, our proprietary cycle indicators and our proprietary Fibonacci price modeling systems suggested a large downside price swing was highly likely.
January 24, 2018: HAVE YOU SEEN PALLADIUM’S TRADABLE PRICE PATTERN?
July 3, 2019: PALLADIUM SETS UP ANOTHER DOUBLE TOP PATTERN
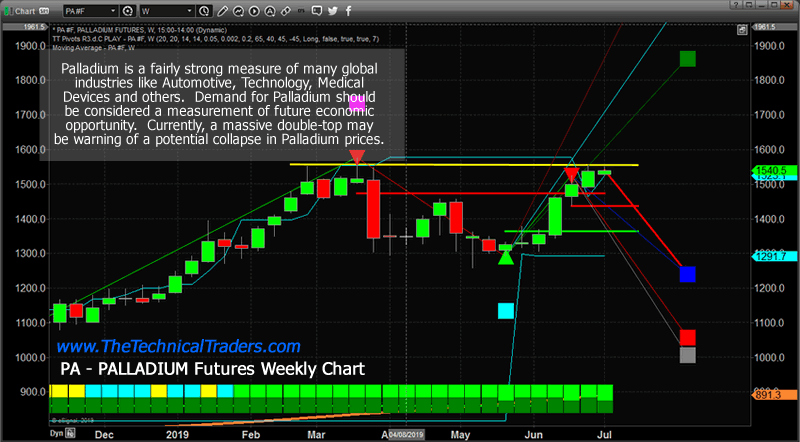
Palladium is a very interesting metal that is used in various industry sectors as a component for automobile equipment/parts, medical equipment, and many other industrial sectors. It is a great leading indicator to help gauge future expectations for various global industries and as a measure of consumer/industrial consumption and expectations. When Palladium is rallying, it is a fairly solid sign that consumers are bullish on the global economy and are purchasing equipment, autos and other industrial elements to support future growth expectations. When Palladium is falling, it is a fairly solid sign that consumers are reigning in their spending on new cars and other industrial items that are manufactured with Palladium.
One of the biggest factors that are likely driving this move in Palladium is the renewed interest in Gold and Silver as the global market enters a very fragile period. Palladium is a precious metal that is used in jewelry and other consumer products – like Gold and Silver. Yet Palladium does not have the status in the precious metals world like Gold and Silver do. When fear and greed enter the markets, Gold, Silver, and Platinum take center-stage. Palladium, because of its more industrial use base, its not something that will rally like Gold and Silver will when a crisis hits.
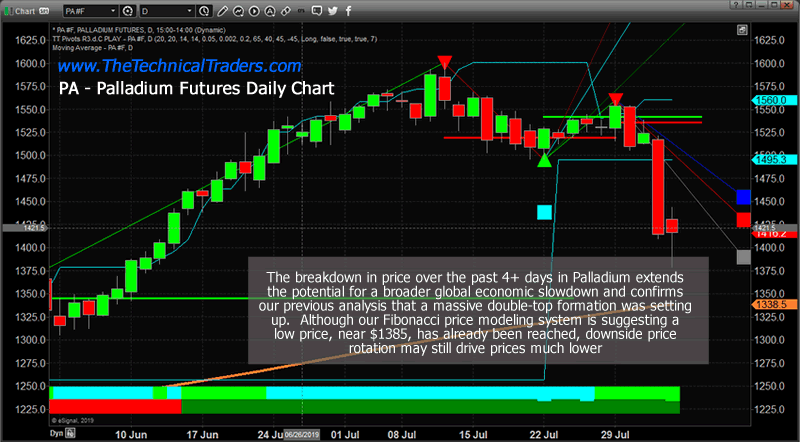
This Daily Palladium chart shows how the weakness in price started just after the price peak on July 11, 2019. Over the past 3+ weeks, Palladium rotated downward towards the $1500 price level, then stalled. Global traders were focused on earnings data, the US Fed announcement, and other data.
The recent breakdown is a result of three factors
_ US Fed rates decrease (expecting weaker global economic output)
_ The rally in Gold and Silver (where global traders are starting to focus their attention)
_ The fragility of global economic/trade functions that continue to plague the global markets
These three factors will move the focus away from industrial use metals (Copper, Palladium, and Aluminum) and towards the more traditional Gold/Silver moves.
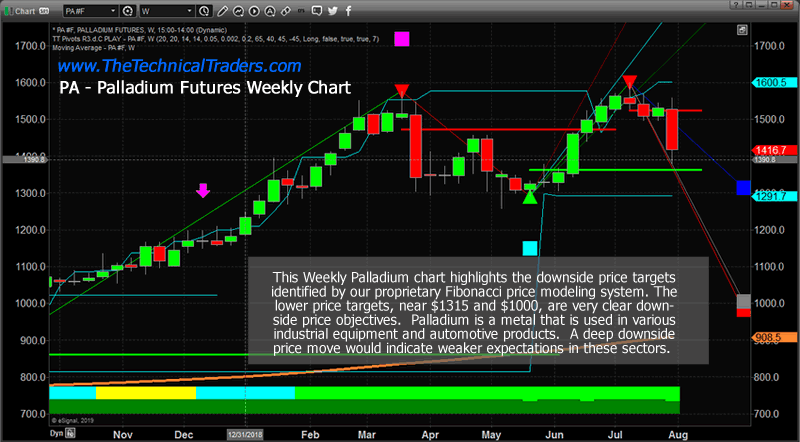
This Weekly Palladium chart highlights the Fibonacci price modeling system’s lower target levels. Pay attention to the fact that $1315 and $1000 are key downside target levels in Palladium. The Daily chart Fibonacci levels suggest that minor support may be found near $1400. The Weekly Fibonacci chart suggests major support is really down near $1000.
CONCLUDING THOUGHTS:
We believe once the $1475 level is breached to the downside, Palladium will quickly fall to levels near $1300 before briefly stalling and attempting to find support. This move in Palladium aligns almost perfectly with our August 19 US market “Peak” prediction from months ago. We believe the ultimate lower levels, near $1000, are a very strong possibility over the next 3+ months as we believe the global markets, and the US markets, are setting up for a fairly big price rotation after August 19, 2019.
Don’t miss any of these big moves or our incredible research posts. Find out how www.TheTechnicalTraders.com can help you find and execute better trades and prepare for these big price swings that are about to explode.
NEXT TRENDS FOR GOLD, SILVER, MINERS, AND S&P 500
In early June I posted a detailed video explaining in showing the bottoming formation and gold and where to spot the breakout level, I also talked about crude oil reaching it upside target after a double bottom, and I called short term top in the SP 500 index. This was one of my premarket videos for members it gives you a good taste of what you can expect each and every morning before the Opening Bell. Watch Video Here.
I then posted a detailed report talking about where the next bull and bear markets are and how to identify them. This report focused mainly on the SP 500 index and the gold miners index. My charts compared the 2008 market top and bear market along with the 2019 market prices today. See Comparison Charts Here.
On June 26th I posted that silver was likely to pause for a week or two before it took another run up on June 26. This played out perfectly as well and silver is now head up to our first key price target of $17. See Silver Price Cycle and Analysis.
More recently on July 16th, I warned that the next financial crisis (bear market) was scary close, possibly just a couple weeks away. The charts I posted will make you really start to worry. See Scary Bear Market Setup Charts.
CONCLUDING THOUGHTS:
In short, you should be starting to get a feel of where stocks are headed along with precious metals for the next 8-24 months. The next step is knowing when and what to buy and sell as these turning points take place, and this is the hard part. If you want someone to guide you through the next 12-24 months complete with detailed market analysis and trade alerts (entry, targets and exit price levels) join my ETF Trading Newsletter.
Be prepared for these incredible price swings before they happen and learn how you can identify and trade these fantastic trading opportunities in 2019, 2020, and beyond with our Wealth Building & Global Financial Reset Newsletter. You won’t want to miss this big move, folks. As you can see from our research, everything has been setting up for this move for many months – most traders/investors have simply not been looking for it.
Join me with a 1 or 2-year subscription to lock in the lowest rate possible and ride my coattails as I navigate these financial market and build wealth while others lose nearly everything they own during the next financial crisis.
As a technical analysis and trader since 1997, I have been through a few bull/bear market cycles. I believe I have a good pulse on the market and timing key turning points for both short-term swing trading and long-term investment capital. The opportunities are massive/life-changing if handled properly.
FREE GOLD & SILVER WITH MEMBERSHIPS
So kill two birds with one stone and subscribe for two years to get your FREE PRECIOUS METAL and get enough trades to profit through the next metals bull market and financial crisis!
Chris Vermeulen
www.TheTechnicalTraders.com
Chris Vermeulen has been involved in the markets since 1997 and is the founder of Technical Traders Ltd. He is an internationally recognized technical analyst, trader, and is the author of the book: 7 Steps to Win With Logic
Through years of research, trading and helping individual traders around the world. He learned that many traders have great trading ideas, but they lack one thing, they struggle to execute trades in a systematic way for consistent results. Chris helps educate traders with a three-hour video course that can change your trading results for the better.
His mission is to help his clients boost their trading performance while reducing market exposure and portfolio volatility.
He is a regular speaker on HoweStreet.com, and the FinancialSurvivorNetwork radio shows. Chris was also featured on the cover of AmalgaTrader Magazine, and contributes articles to several leading financial hubs like MarketOracle.co.uk
Disclaimer: Nothing in this report should be construed as a solicitation to buy or sell any securities mentioned. Technical Traders Ltd., its owners and the author of this report are not registered broker-dealers or financial advisors. Before investing in any securities, you should consult with your financial advisor and a registered broker-dealer. Never make an investment based solely on what you read in an online or printed report, including this report, especially if the investment involves a small, thinly-traded company that isn’t well known. Technical Traders Ltd. and the author of this report has been paid by Cardiff Energy Corp. In addition, the author owns shares of Cardiff Energy Corp. and would also benefit from volume and price appreciation of its stock. The information provided here within should not be construed as a financial analysis but rather as an advertisement. The author’s views and opinions regarding the companies featured in reports are his own views and are based on information that he has researched independently and has received, which the author assumes to be reliable. Technical Traders Ltd. and the author of this report do not guarantee the accuracy, completeness, or usefulness of any content of this report, nor its fitness for any particular purpose. Lastly, the author does not guarantee that any of the companies mentioned in the reports will perform as expected, and any comparisons made to other companies may not be valid or come into effect.
Chris Vermeulen Archive |
© 2005-2022 http://www.MarketOracle.co.uk - The Market Oracle is a FREE Daily Financial Markets Analysis & Forecasting online publication.