


August 19 (Crazy Ivan) Stock Market Event Only A Few Days Away
Stock-Markets / Stock Markets 2019 Aug 13, 2019 - 05:24 PM GMTBy: Chris_Vermeulen

 Our researchers have created this research post to highlight a big price move based on super-cycle research and patterns that should begin on or near August 19, 2019. Back in April/May 2019, we started warning of a critical top formation we believed was aligned for July 2019. In May/June, we altered this date to align more closely with our super-cycle research and determined the August 19, 2019 date.
It is our belief that this date will initiate a breakdown price move that may align with external news related or economic related data. Our research continues to point to the potential for a large global breakdown in equity prices related to some type of near-crisis event. It could be related to something within the US or outside the US – but either way, we slice it, August 19 looks to be the date we need to focus on.
– Crazy Ivan Market Prediction for Stock Market and Volatility Article
– Crazy Ivan Precious Metals Prediction Article
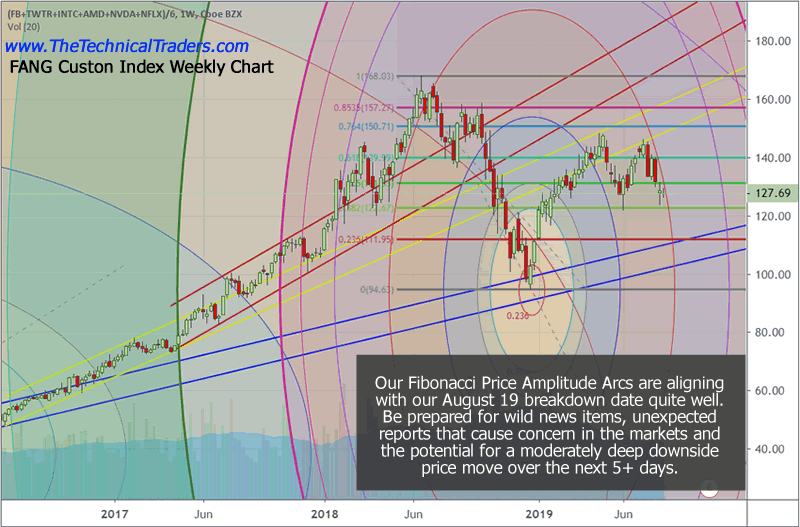
FANG Custom Index Weekly Chart
This FANG custom index weekly chart highlights how our Fibonacci Price Amplitude Arcs work in alignment with price rotation and trends. The theory behind this analysis is that price trends operate at a frequency and amplitude that we can map out – much like Tesla’s theory of Mechanical Resonance.
In our studies, we have learned how to identify relative price amplitude and frequency factors, then align these to price peaks and valleys. The result is that we can see where hidden support and resistance channels form and where the price will potentially reach an “inflection point”.
Right now, this week and next on this FANG chart are likely to see increased volatility and the potential for a price breakdown as the current RED arc level sets up a massive resistance channel.
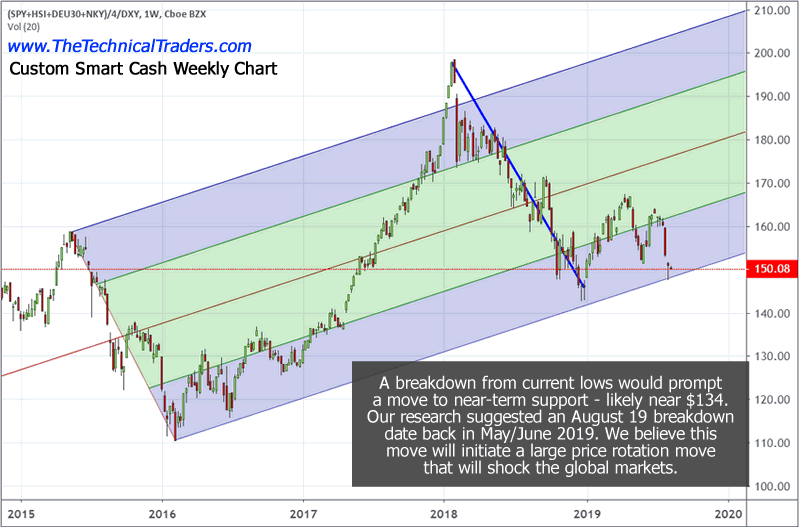
Custom Smart Cash Index Chart
Our custom Smart Cash Index chart is also highlighting an overall weakness in the US and global markets. Once this chart breaks the lower price channel level, there is a very strong possibility that this index will break down toward the $134 level (or lower) as the global markets attempt to identify price support. Overall lows could target the $111 level (seeing in 2016) if the breakdown is excessive.
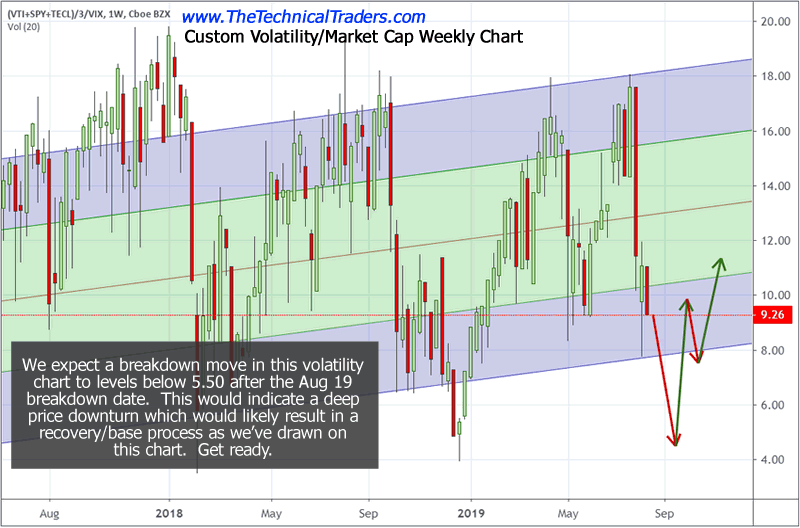
Custom Volatility Index
This Custom Volatility Index is suggesting a deeper price low is setting up if the August 19 breakdown date acts as we suspect. If the global markets break lower, then this Custom Volatility Index will be pushed into an extreme low territory (below 5.5) were a very deep bottom/base will setup (as we have seen before). If it reaches levels below 4.0, then we should be very close to a very deep “V” type bottom.
The recovery from this base/bottom will likely be somewhat extended as the shift in the capital around the globe seeks out the best, safest locations and returns. We believe this bottom will complete near the end of 2019 or into early 2020 where the US markets will quickly gain acceptance as the location for global assets to avoid extended risks.
What Does All This Mean?
August 19 is only a few days away and we could see fireworks start in the global financial market place.
If our analysis is correct, we have only 4 to 7+ days before a major breakdown in price starts and we are yet unsure of the source or intensity of this event if there is one. Multiple analysis types are pointing to August as a key turn date and the market could fall by as much as 16-25% if there is a trigger event to spark the crisis.
What should you do? Well, being a pilot, quasi engineer, and technical trader using logic, rules, and processes to do things. I always wait for the price to confirm a new trend before taking action and entering a position. This is how we profited last week from the SP500 index falling. We traded the 2x bear fund SDS and locked in a quick profit.
The days are long gone where I would buy or sell stocks or trends based on tips and forecasts. That type of trading is really called legal gambling and the odds generally are not in your favor unless you tips are coming from insiders who actually know something.
Using technical analysis and proven strategies we can follow the market trends and profit from them no matter which the market moves. We bet with the market (the house) and provide entry, target, and stops for all trades we initiate.
Join Me And Trade With a Proven Strategy Today!
Chris Vermeulen
www.TheTechnicalTraders.com
Chris Vermeulen has been involved in the markets since 1997 and is the founder of Technical Traders Ltd. He is an internationally recognized technical analyst, trader, and is the author of the book: 7 Steps to Win With Logic
Through years of research, trading and helping individual traders around the world. He learned that many traders have great trading ideas, but they lack one thing, they struggle to execute trades in a systematic way for consistent results. Chris helps educate traders with a three-hour video course that can change your trading results for the better.
His mission is to help his clients boost their trading performance while reducing market exposure and portfolio volatility.
He is a regular speaker on HoweStreet.com, and the FinancialSurvivorNetwork radio shows. Chris was also featured on the cover of AmalgaTrader Magazine, and contributes articles to several leading financial hubs like MarketOracle.co.uk
Disclaimer: Nothing in this report should be construed as a solicitation to buy or sell any securities mentioned. Technical Traders Ltd., its owners and the author of this report are not registered broker-dealers or financial advisors. Before investing in any securities, you should consult with your financial advisor and a registered broker-dealer. Never make an investment based solely on what you read in an online or printed report, including this report, especially if the investment involves a small, thinly-traded company that isn’t well known. Technical Traders Ltd. and the author of this report has been paid by Cardiff Energy Corp. In addition, the author owns shares of Cardiff Energy Corp. and would also benefit from volume and price appreciation of its stock. The information provided here within should not be construed as a financial analysis but rather as an advertisement. The author’s views and opinions regarding the companies featured in reports are his own views and are based on information that he has researched independently and has received, which the author assumes to be reliable. Technical Traders Ltd. and the author of this report do not guarantee the accuracy, completeness, or usefulness of any content of this report, nor its fitness for any particular purpose. Lastly, the author does not guarantee that any of the companies mentioned in the reports will perform as expected, and any comparisons made to other companies may not be valid or come into effect.
Chris Vermeulen Archive |
© 2005-2022 http://www.MarketOracle.co.uk - The Market Oracle is a FREE Daily Financial Markets Analysis & Forecasting online publication.