


Silver, Transports, and Dow Jones Index At Targets – What Direct Next?
Stock-Markets / Stock Markets 2019 Aug 16, 2019 - 05:40 PM GMTBy: Chris_Vermeulen

 As you can probably imagine, we’ve received a ton of emails and questions about our recent predictions for precious metals and the August 19 breakdown date in the global markets. It seems everyone is reading our research posts and is curious about how to prepare for these moves and how we came up with these predictions months in advance. In this second part of our metals & Aug 19 update post, we’ll try to highlight our expectations going into the weekend prior to the Aug 19 breakdown date (Monday).
In the first part of this research post, we highlighted what we believe is the imminent completion of the MID Leg 1 upside move in precious metals. Our research continues to suggest that we are still setting up a major LEG 1 upside move which should be considered a larger Elliot Wave structure. Within this Wave (Leg) 1 formation, a typical 5 wave structure is likely to continue forming. Currently, we are creating the Wave 3 of the total of 5 waves that will complete a finished upside Wave (Leg 1).
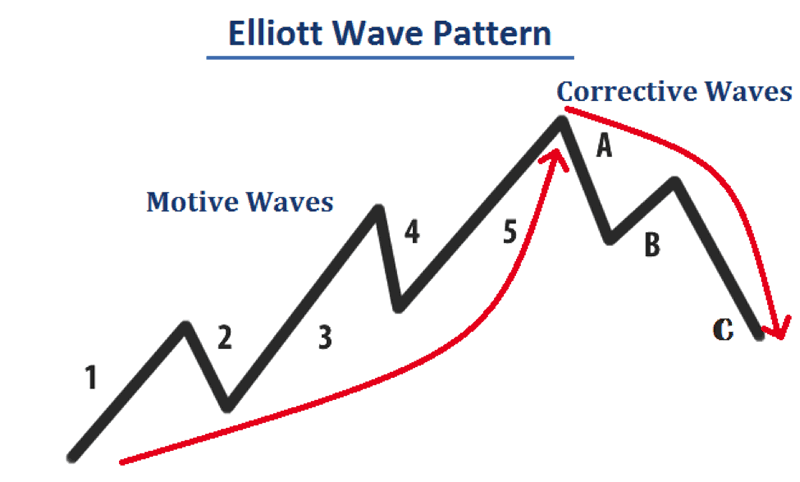
If our analysis is correct, the peak that ends Wave 1 could be well above $2000 for Gold and well above $24 to $28 for Silver. Then, of course, we’ll set up for a corrective Wave #2 before another, BIGGER, upside wave #3 sets up in precious metals.
Taking a look at this Weekly Silver chart, you may be able to see the waves as we see them..
_ The upside price move from Dec 14, 2015, to July 4, 2016 sets up the initial upside Wave 1 leg.
_ The low in November 2018 sets up the end of corrective wave B from the initial bottom on December 14, 2015.
_ This setup suggests we are currently starting a Wave 3 upside move which is usually 1.5x larger (or more) than Wave 1.
_ Keep in mind that we believe all of these “minor wave” formations are part of a much larger 5 wave structure that is setting up.
As you look at the Fibonacci diagram, above, remember that within each of those waves (1 through 5), a typical complex price wave formation (1, 3, 5, or other more complex wave formation) will set up to complete the broader wave formation. Therefore, as you review the chart below, keep in mind that we believe everything originating from the bottom on December 14, 2015, till now is still part of the WAVE 1 formation on that Elliot Wave chart. We are just getting started with this move, folks.
Silver Weekly Chart with Wave 1
The YELLOW arrows we’ve drawn on this Silver chart are our expectations for Silver over the next 6+ weeks and will potentially complete the initial upside minor wave 3 formation/ Leg 1. We do understand that Elliot Wave counting can be difficult to understand, but please allow use to preface this research by suggesting that every larger wave consists of smaller waves. And those smaller waves, consist of sets of even smaller waves. And so it continues all the way down to sub-one-minute charts. The point we’re trying to make is that the $21 endpoint on this chart is very likely just the end of Wave 1, subwave 3, impulse move C which may target a total of D moves before reaching the end of subwave 3. To put it in more simple terms, we are only about 20% into this upside move right now based on our expectations.

Why is the move in precious metals so important for our August 19 breakdown date prediction? Because we would expect precious metals to begin a massive price rally if the global stock markets were expecting some type of major downside rotational event. A more into metals is a safety play for global investors. If something is happening in the markets and fear becomes more evident, then precious metals should start to rally. This sets up an expectation that some type of price revaluation event is likely to take place in the near future.
Thus, the upside price moves in Gold and Silver align perfectly with our August 19 breakdown expectation. The key to this, in our opinion, is that Silver has really started to skyrocket on large volume. This creates “confluence” in the metals group that fear is now driving investors into the lesser Silver market in preparation for a price reversion move soon.
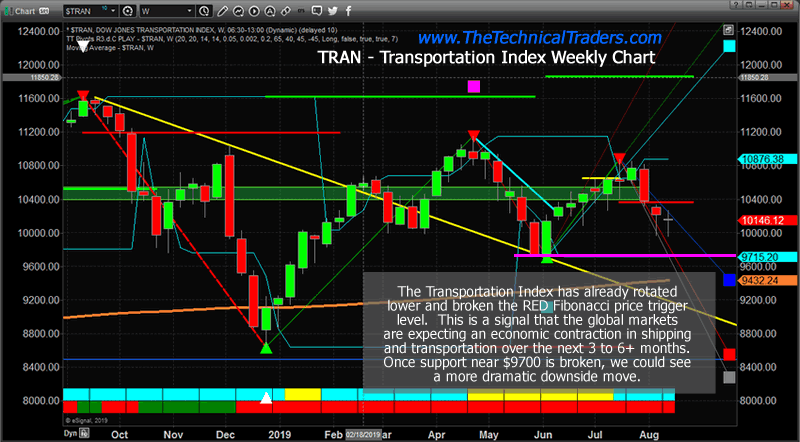
Weekly Transportation Index chart
This Transportation Index chart highlights the fact that investors believe the future 3 to 6 months in the global economy will be moderately slower and that transportation activity and revenues will likely continue to diminish. The Transportation Index is an excellent measure of future global economic expectations that can be used as a “general market indicator” for future expectations.
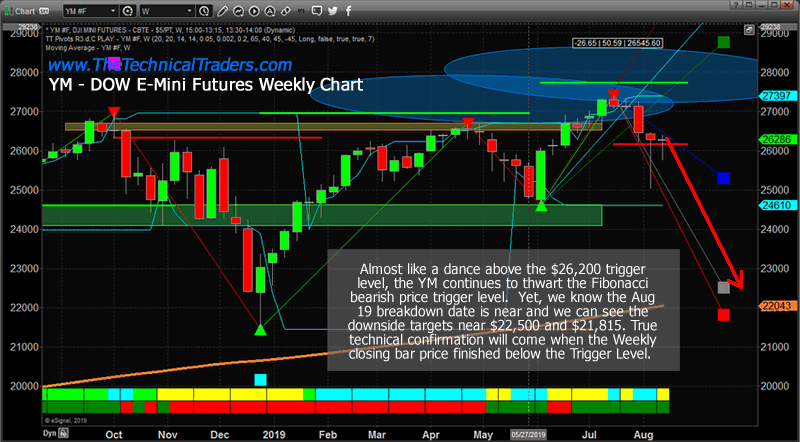
Dow Jones Weekly Chart
This YM Weekly chart highlights the key Fibonacci price trigger level that has setup near $26,170. This is the critical price level for the YM to actually generate a confirmed Bearish price trend (end of week closing bar price level) which may be the initial downside price trigger. As of the creation of this chart, the YM price was above this Fibonacci trigger level. But as of right now, the YM price is already below the Fibonacci trigger level and if the YM closes the week below this level, then we would have a new confirmed Bearish Fibonacci price trend.
CONCLUDING THOUGHTS:
The interesting fact behind all of this is that these predictions were made by our research team months before today. Our Gold prediction was initiated near October 5, 2018. Our August 19 breakdown date was initiated near May 2019 (originally as a July Topping pattern expectation and later revised to the August 19 breakdown date). All of these predictions were created using our proprietary price modeling, predictive analysis tools, and advanced cycle analysis tools.
We find it absolutely incredible that we are able to make these types of predictions many months into the future and watch the markets do exactly what we suggested would happen. Obviously, we hope you are finding value in our research posts and modeling systems as well?
If you have not already prepared for the August 19 breakdown date prediction, we would suggest that you consider how you would want to protect any open long positions at this time (headed into the weekend) and set up your portfolio for a broader market rotation and upside move in precious metals over the next 3+ months. It is not too late to take action to protect your assets – even weeks past August 19, you can still act to take advantage of these bigger price moves. We are simply urging you to plan and prepare for these moves as you read our research posts.
FORECASTED MOVES FOR GOLD, SILVER, MINERS, AND STOCK INDEXES
In early June I posted a detailed video explaining in showing the bottoming formation and gold and where to spot the breakout level, I also talked about crude oil reaching it upside target after a double bottom, and I called short term top in the SP 500 index. This was one of my premarket videos for members it gives you a good taste of what you can expect each and every morning before the Opening Bell. Watch Video Here.
I then posted a detailed report talking about where the next bull and bear markets are and how to identify them. This report focused on gold miners and the SP 500 index. My charts compared the 2008 market top and bear market along with the 2019 market prices today. See Comparison Charts Here.
On June 26th I posted that silver was likely to pause for a week or two before it took another run up on June 26. This played out perfectly as well and silver is now head up to our first key price target of $17. See Silver Price Cycle and Analysis.
More recently on July 16th, I warned that the next financial crisis (bear market) was scary close, possibly just a couple weeks away. The charts I posted will make you really start to worry. See Scary Bear Market Setup Charts.
Join Me And Trade With a Proven Strategy Today!
Chris Vermeulen
www.TheTechnicalTraders.com
Chris Vermeulen has been involved in the markets since 1997 and is the founder of Technical Traders Ltd. He is an internationally recognized technical analyst, trader, and is the author of the book: 7 Steps to Win With Logic
Through years of research, trading and helping individual traders around the world. He learned that many traders have great trading ideas, but they lack one thing, they struggle to execute trades in a systematic way for consistent results. Chris helps educate traders with a three-hour video course that can change your trading results for the better.
His mission is to help his clients boost their trading performance while reducing market exposure and portfolio volatility.
He is a regular speaker on HoweStreet.com, and the FinancialSurvivorNetwork radio shows. Chris was also featured on the cover of AmalgaTrader Magazine, and contributes articles to several leading financial hubs like MarketOracle.co.uk
Disclaimer: Nothing in this report should be construed as a solicitation to buy or sell any securities mentioned. Technical Traders Ltd., its owners and the author of this report are not registered broker-dealers or financial advisors. Before investing in any securities, you should consult with your financial advisor and a registered broker-dealer. Never make an investment based solely on what you read in an online or printed report, including this report, especially if the investment involves a small, thinly-traded company that isn’t well known. Technical Traders Ltd. and the author of this report has been paid by Cardiff Energy Corp. In addition, the author owns shares of Cardiff Energy Corp. and would also benefit from volume and price appreciation of its stock. The information provided here within should not be construed as a financial analysis but rather as an advertisement. The author’s views and opinions regarding the companies featured in reports are his own views and are based on information that he has researched independently and has received, which the author assumes to be reliable. Technical Traders Ltd. and the author of this report do not guarantee the accuracy, completeness, or usefulness of any content of this report, nor its fitness for any particular purpose. Lastly, the author does not guarantee that any of the companies mentioned in the reports will perform as expected, and any comparisons made to other companies may not be valid or come into effect.
Chris Vermeulen Archive |
© 2005-2022 http://www.MarketOracle.co.uk - The Market Oracle is a FREE Daily Financial Markets Analysis & Forecasting online publication.