


The Next Stock Market Breakdown And The Setup
Stock-Markets / Stock Markets 2019 Aug 20, 2019 - 07:52 AM GMTBy: Chris_Vermeulen

 If you’ve been following our research long enough, you’ll remember that we often discuss Fibonacci Price Theory and how we use it to try to identify opportunities and trends in the markets. The basic premise of Fibonacci Price Theory is that price is always seeking to establish newer highs or newer lows with every rotation on the charts. The theory is rather simple to understand and learn and it helps easily identify where support, resistance, and the trend is established. Let’s take a minute to go over the basics of Fibonacci Price Theory before we continue.
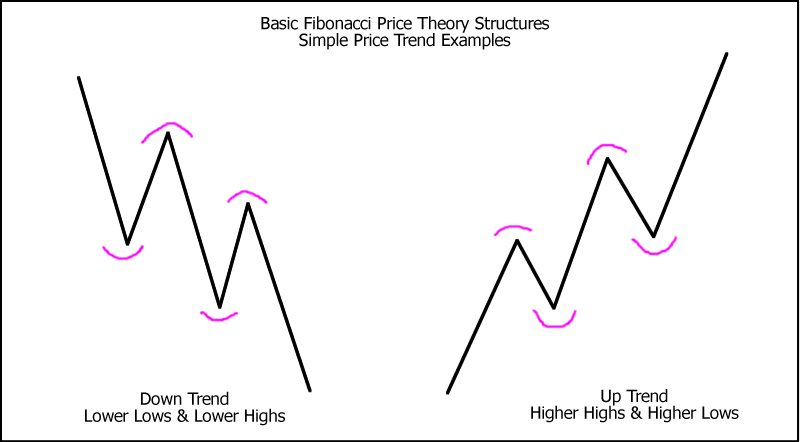
This first example of Fibonacci Price Theory trend is a simple example that highlights the basic premise of the theory – price move always attempts to establish new price highs or new price lows in a trend. Therefore, in a downtrend, we would attempt to observe price in a simple structure as you see on the left side of this example – establishing new lower lows and new lower highs in a series of waves. In an uptrend, we would attempt to observe price in an opposite structure where new higher highs and new higher lows are set up. Fairly simple so far – right?
In complex price rotations, we have to understand that we are changing the perspective of price trend when we are looking at different intervals of price data. When we are investigating a 10-minute chart, we will see shorter-term Fibonacci price structure which may appear to be counter to our longer-term charts (Daily, Weekly or other intervals). This is because the Fibonacci Price Theory works on all intervals and attempts to identify price structure and trend based on price rotations and true price structure.
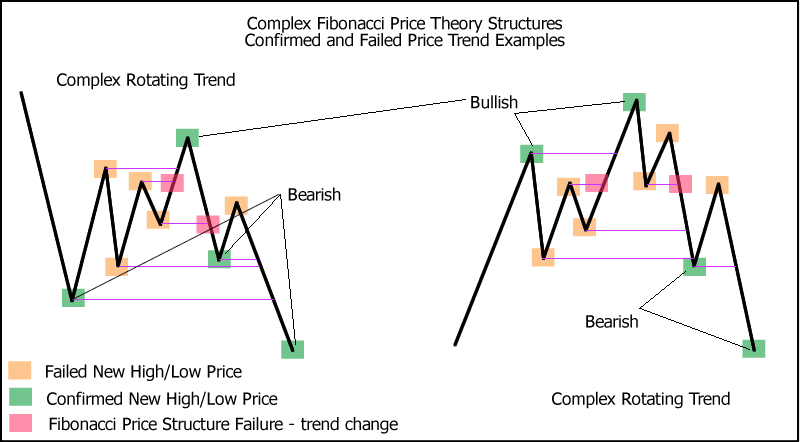
In the complex example, below, we’ve drawn some samples that show price rotation within a trend. The first example, on the left, is a continued DOWNTREND with a failed bullish high near the middle. This happens often as price enters a congestion period. Notice that after the initial new low, price rotated within a range, then broke out setting up the bullish “new high”, but then immediately failed and moved lower. Sometimes you’ll hear us report this type of setup as a “washout high”. This failed trigger immediately sets up a bigger downside price move as the price was unable to find support above the previous high levels. As soon as price rotated lower after that peak and took out those previous highs, we should have been very cautious of the upside potential. When it took out the most recent low (shown with the PINK box), that was our trigger that the bullish trend was OVER and the new bearish trend was setup.
On the right side, we have a complete price rotation (from bullish to bearish). We can see the upside trend initially set up with a new price high, then price consolidated into a range. Once price broke above the most recent range high (highlighted with the PINK box), that was a new bullish trigger that price should attempt to move higher. After it broke the previous GREEN peak, that provides even further confirmation of an uptrend.
Once the second big peak setup, the price moved lower to set up a rotational low and high price that established our Fibonacci Price Theory trigger range. A move above that last high would provide confirmation that the trend should continue to move higher and a move below that last low would provide confirmation that the trend has reversed into a bearish trend. The price moved lower (see the PINK box) and we set up a new bearish price trend based on these simple price rotations.
We hope these examples allowed you to better understand the next series of charts below. Look for these structures in the real price of these charts and see if you can see what we see in terms of the “Setup”.
Its this type of analysis and chart patterns that have allowed us to make over 24% profit in August with a few trades. Also, very soon we will be adding some incredible new trading tools that allow you to forecast the markets turning points, spot momentum, swing, and trend trades automatically.
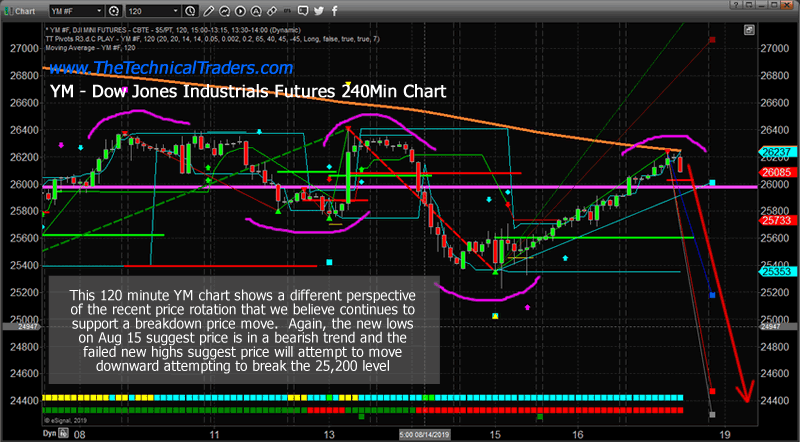
First, let’s start with the YM 120-minute chart and what we believe is the SETUP for our August 19 breakdown prediction. Looking at this chart, we have a DOUBLE-TOP type of setup on the left side where two price high setups aligned within a few ticks of one another. What confirms this as a DOUBLE-TOP is the subsequent breakdown of price setting up the August 15 price low near 25,400. Since that breakdown (establishing a new lower low), we can presume the trend is Bearish based on Fibonacci Price Theory and we can assume that a new breakdown trend may be setting up on the hard right edge of this chart. This new rotation near the right edge of the chart may turn into a complex price rotation, but we believe the downside move will eventually become very clear to traders based on our August 19 breakdown prediction.
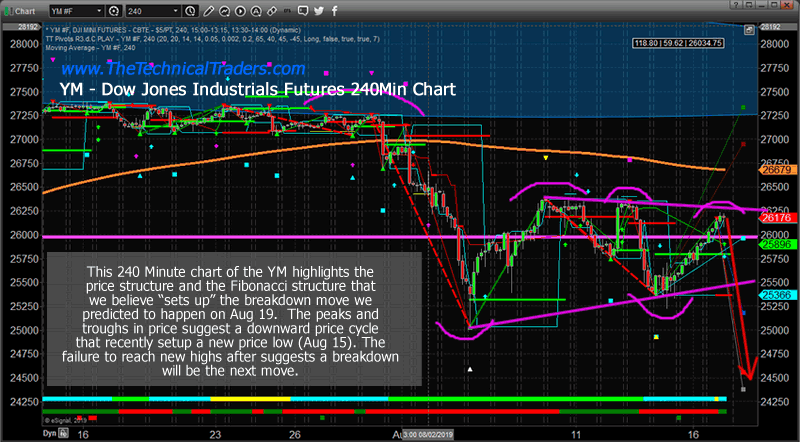
This YM 240 Minute chart reflects a different perspective of the same trend. We still see the extended DOUBLE-TOP formation after the bigger breakdown in price in early August. We also see the August 15 low as a complex price rotation setting up near the right edge of this chart. Now, think about the examples we used to try to help you understand this type of Fibonacci Price Theory setup? We have a big downside price move in early August – setting up a new bearish price trend. In order for us to attempt to confirm a reversal of that bearish trend, we would need to see a price peak setup and be breached with a new higher high type of price setup. Given that no new price high has broken above the late July price highs and each subsequent price peak has set up in either a DOUBLE-TOP formation or a lower high type of price structure – what are we left to conclude? This is still a bearish price trend setup and that means we should expect a new downside price leg to attempt to establish a new price low.
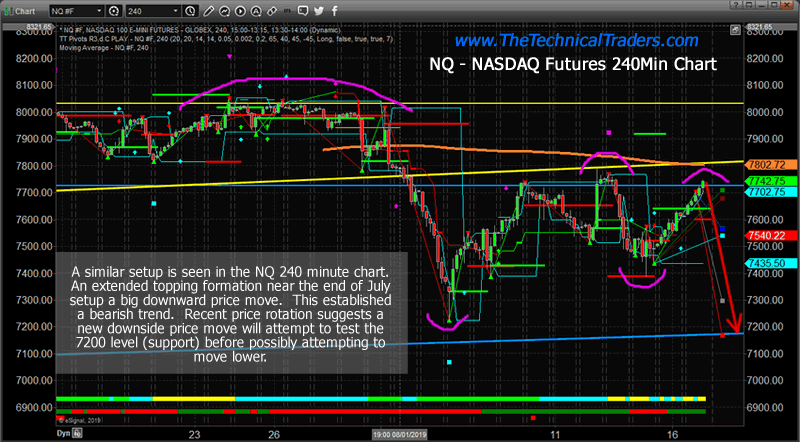
Here is the NQ 240 minute chart. Take a look at this and use your new skills to try to understand why we believe the eventual price breakdown will happen? This is almost exactly like the Complex Fibonacci Price Structure on the RIGHT SIDE of the example we provided (above). A deep downside move sets up a bearish trend. Moderate upside price rotation in early August sets up a bullish corrective wave (because no new price high broke above the 8050 highs). After the corrective wave exhausted near August 15, it broke downward to establish the recent new low near 7400 (notice the attempted “washout high” near August 14th?). Currently, the new price low from August 15 sets the trend as a confirmed downside bearish trend that we expect will setup another new price low below 7400. The only thing that would change that is if the price were able to move above 7800 and establish a new higher high.
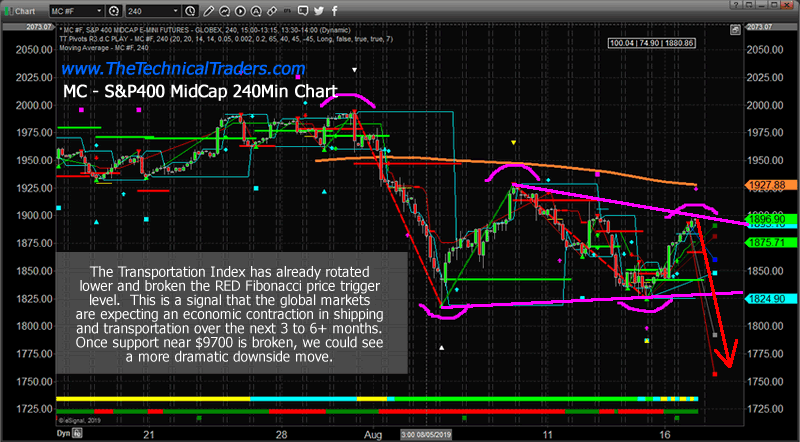
Lastly, here is the MC (S&P 400 MidCap) 240-minute chart. We love using the MIDCAP and TRAN charts because they often provide a much clearer picture of true price structure than the ES, YM and NQ charts do. Pay attention to the MAGENTA ARCS I’ve drawn on this chart. See anything interesting? I know that I see from this chart and why I believe my August 19th breakdown prediction is going to be accurate. Take a minute to study this chart and come to your own conclusion about the price structure.
There you have it, folks. We made a prediction about a July 2019 market top setup and an August 19 breakdown in price many months back. How did we know about these setups? We are using our proprietary price modeling and predictive modeling systems along with various technical analysis tools and years of study and research into technical analysis and price structures. We can attempt to use our proprietary tools to help traders, like you, stay well ahead of these moves and find greater profits.
All we have to do now is wait for the new rotation in price to either confirm or invalidate our breakdown analysis. At this point, it is all up to the price, investor confidence and “fear and greed”.
CONCLUDING THOUGHTS:
In short, you should be starting to get a feel of where each commodity and asset class is headed for the next 8+ months. The next step is knowing when and what to buy and sell as these turning points take place, and this is the hard part. If you want someone to guide you through the next 12-24 months complete with detailed market analysis and trade alerts (entry, targets and exit price levels) join my ETF Trading Newsletter.
Be prepared for these incredible price swings before they happen and learn how you can identify and trade these fantastic trading opportunities in 2019, 2020, and beyond with our Wealth Building & Global Financial Reset Newsletter. You won’t want to miss this big move, folks. As you can see from our research, everything has been setting up for this move for many months.
Join me with a 1 or 2-year subscription to lock in the lowest rate possible and ride my coattails as I navigate these financial market and build wealth while others lose nearly everything they own during the next financial crisis.
As a technical analysis and trader since 1997, I have been through a few bull/bear market cycles. I believe I have a good pulse on the market and timing key turning points for both short-term swing trading and long-term investment capital. The opportunities starting to present themselves will be life-changing if handled properly.
FREE GOLD OR SILVER WITH MEMBERSHIP!
Kill two birds with one stone and subscribe to get your FREE PRECIOUS METAL (gold or silver) and get our trades that will make you wealthy during the next metals bull market and financial crisis!
Chris Vermeulen
www.TheTechnicalTraders.com
Chris Vermeulen has been involved in the markets since 1997 and is the founder of Technical Traders Ltd. He is an internationally recognized technical analyst, trader, and is the author of the book: 7 Steps to Win With Logic
Through years of research, trading and helping individual traders around the world. He learned that many traders have great trading ideas, but they lack one thing, they struggle to execute trades in a systematic way for consistent results. Chris helps educate traders with a three-hour video course that can change your trading results for the better.
His mission is to help his clients boost their trading performance while reducing market exposure and portfolio volatility.
He is a regular speaker on HoweStreet.com, and the FinancialSurvivorNetwork radio shows. Chris was also featured on the cover of AmalgaTrader Magazine, and contributes articles to several leading financial hubs like MarketOracle.co.uk
Disclaimer: Nothing in this report should be construed as a solicitation to buy or sell any securities mentioned. Technical Traders Ltd., its owners and the author of this report are not registered broker-dealers or financial advisors. Before investing in any securities, you should consult with your financial advisor and a registered broker-dealer. Never make an investment based solely on what you read in an online or printed report, including this report, especially if the investment involves a small, thinly-traded company that isn’t well known. Technical Traders Ltd. and the author of this report has been paid by Cardiff Energy Corp. In addition, the author owns shares of Cardiff Energy Corp. and would also benefit from volume and price appreciation of its stock. The information provided here within should not be construed as a financial analysis but rather as an advertisement. The author’s views and opinions regarding the companies featured in reports are his own views and are based on information that he has researched independently and has received, which the author assumes to be reliable. Technical Traders Ltd. and the author of this report do not guarantee the accuracy, completeness, or usefulness of any content of this report, nor its fitness for any particular purpose. Lastly, the author does not guarantee that any of the companies mentioned in the reports will perform as expected, and any comparisons made to other companies may not be valid or come into effect.
Chris Vermeulen Archive |
© 2005-2022 http://www.MarketOracle.co.uk - The Market Oracle is a FREE Daily Financial Markets Analysis & Forecasting online publication.