


Is Stock Market Price Revaluation Event About To Happen?
Stock-Markets / Stock Markets 2019 Sep 21, 2019 - 09:58 AM GMTBy: Chris_Vermeulen

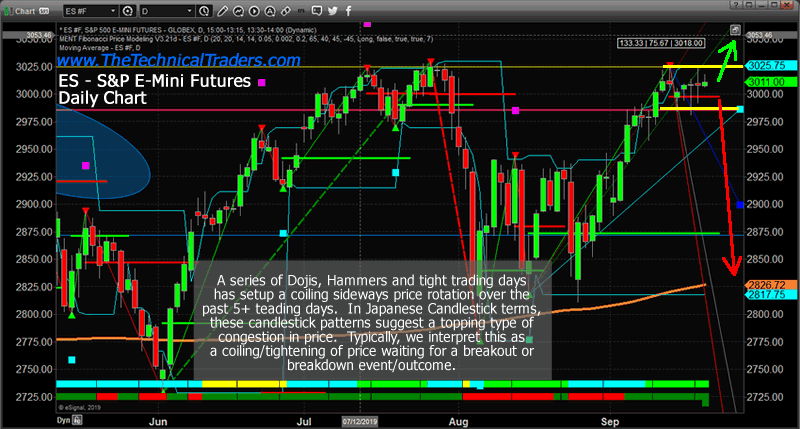
 Skilled technical traders must be aware that price is setting up for a breakout or breakdown event with recent Doji, Hammer and other narrow range price bars. These types of Japanese Candlestick patterns are warnings that price is coiling into a tight range and the more we see them in a series, the more likely price is building up some type of explosive price breakout/breakdown move in the near future. The ES (S&P 500 E-mini futures) chart is a perfect example of these types of price bars on the Daily chart (see below).
Tri-Star Tops, Three River Evening Star patterns, Hammers/Hangmen and Dojis are all very common near extreme price peaks and troughs. The reason they form is that price is unable to rally or fall far enough within a normal trading day to project broader range types of Japanese Candlestick patterns and these rotational/top/bottom types of Japanese candlestick patterns are often found at or near key reversal points in price. When they form in a series, like we are seeing currently, it is a very ominous warning that price will react in an explosive movement – either UP or DOWN. Be sure to opt-in to our Free Trade Ideas Newsletter.
Here are some examples of how these types of Japanese Candlesticks may appear in a chart.
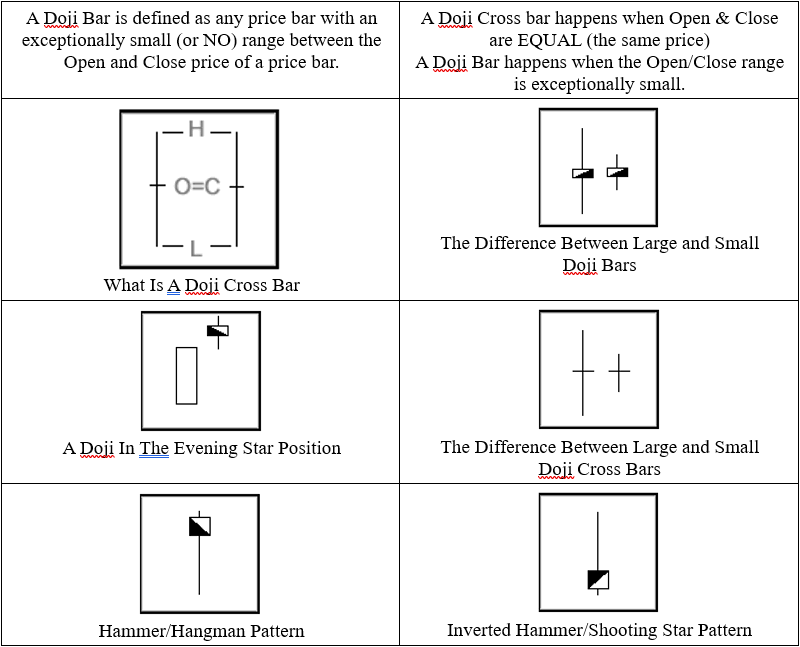
Hammer type of patterns are similar to Doji pattern because the difference between the open/close price is very narrow. Yet, instead of the Open/Close range forming near the middle of the price bar, Hammers form when this range forms near the high or low of the price bar. They fall into the “umbrella” group of patterns and warrant a bit of extra consideration depending on where they form in price. The can often create very clear warning signals just prior to a major price reversal.
SP500 (ES) Daily Chart
This ES Daily chart highlights the sideways DOJI/HAMMER price channel that is setting up over the past 5+ trading days. We believe this sideways, narrow price range, is going to prompt a massive price breakout or breakdown in the near future. Historically, this current price level is strong resistance, thus, until we see any price move above 3035 on the ES, we must assume this resistance will continue to hold and a breakdown event may be the likely outcome. The only way we can determine if price is capable of attempting to move higher is to wait for price to actually make a new high price above previous resistance.
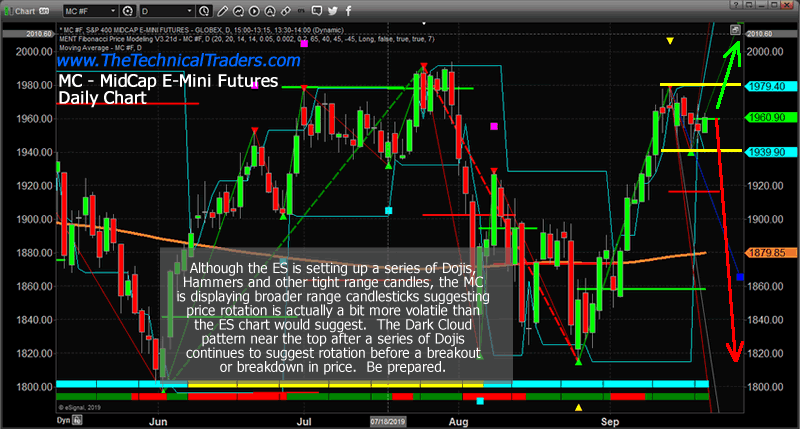
Mid Cap Index Daily Chart
This MC, MidCap, Daily chart highlights the same period of time, but notice the range of the price bars on this MC chart are broader in range and scope. We are not seeing Dojis bars like we are seeing on the ES chart. This suggests that the real price action is taking place in the MidCap market, the Transportation Index and other trading instruments. We would likely need to watch how the rest of the market is reacting to this sideways trading while attempting to understand that the S&P is setting up for a big breakout or breakdown event.
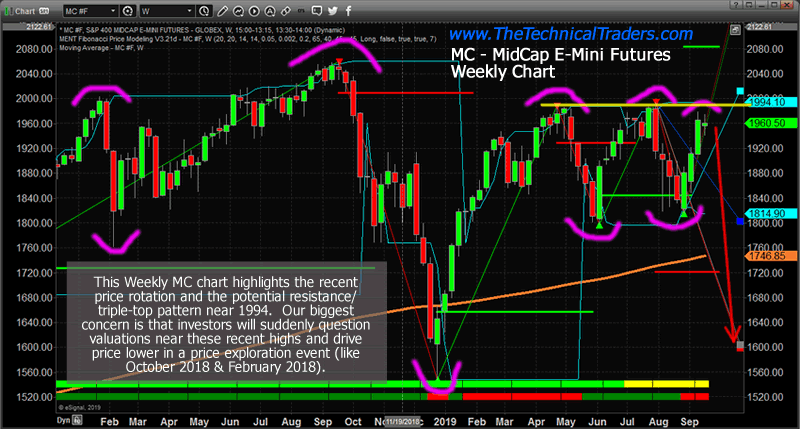
Mid Cap Index Weekly Chart
This MC Weekly chart hSP500 (ES) Daily Chartelps us to understand the past 2+ years price rotation and why the current price levels, near 2000, are so important. In January 2018, price collapsed from these levels. In October 2018, price again collapsed from these levels – into a massive -24.85% downside move. Currently, we’ve seen price test the 1995 level multiple times and fail. Will it fail again and what is the potential for a broader downside price move?
As we stated earlier, until price is able to clear the 2000 price level, we must assume that resistance near 2000 will continue to hold and that price is more likely to move lower than higher at this time. The only way we can determine if price is going to attempt to rally is to wait for it to attempt to reach a new high price from within recent price rotation.
Headed into this weekend, we would strongly suggest that all skilled technical traders plan for and prepare for some type of external new events, crisis events or anything that could drive price higher or lower. It seems news is one of the biggest driving factors in the global markets recently. Traders/investors are waiting for an impetus to drive trends. The US Fed dropping rates really didn’t do much to improve investor sentiment. It appears global traders want something BIGGER and BROADER to push prices higher at this time. Improved global trade and economic ties would do it – but we don’t think that is going to happen within the next 3+ months.
Get ready for a wild ride and be sure to subscribe to my ETF trading newsletter so you don’t miss these opportunities www.TheTechnicalTraders.com
Chris Vermeulen
www.TheTechnicalTraders.com
Chris Vermeulen has been involved in the markets since 1997 and is the founder of Technical Traders Ltd. He is an internationally recognized technical analyst, trader, and is the author of the book: 7 Steps to Win With Logic
Through years of research, trading and helping individual traders around the world. He learned that many traders have great trading ideas, but they lack one thing, they struggle to execute trades in a systematic way for consistent results. Chris helps educate traders with a three-hour video course that can change your trading results for the better.
His mission is to help his clients boost their trading performance while reducing market exposure and portfolio volatility.
He is a regular speaker on HoweStreet.com, and the FinancialSurvivorNetwork radio shows. Chris was also featured on the cover of AmalgaTrader Magazine, and contributes articles to several leading financial hubs like MarketOracle.co.uk
Disclaimer: Nothing in this report should be construed as a solicitation to buy or sell any securities mentioned. Technical Traders Ltd., its owners and the author of this report are not registered broker-dealers or financial advisors. Before investing in any securities, you should consult with your financial advisor and a registered broker-dealer. Never make an investment based solely on what you read in an online or printed report, including this report, especially if the investment involves a small, thinly-traded company that isn’t well known. Technical Traders Ltd. and the author of this report has been paid by Cardiff Energy Corp. In addition, the author owns shares of Cardiff Energy Corp. and would also benefit from volume and price appreciation of its stock. The information provided here within should not be construed as a financial analysis but rather as an advertisement. The author’s views and opinions regarding the companies featured in reports are his own views and are based on information that he has researched independently and has received, which the author assumes to be reliable. Technical Traders Ltd. and the author of this report do not guarantee the accuracy, completeness, or usefulness of any content of this report, nor its fitness for any particular purpose. Lastly, the author does not guarantee that any of the companies mentioned in the reports will perform as expected, and any comparisons made to other companies may not be valid or come into effect.
Chris Vermeulen Archive |
© 2005-2022 http://www.MarketOracle.co.uk - The Market Oracle is a FREE Daily Financial Markets Analysis & Forecasting online publication.