


Predictive Modeling Suggests Stock Market Rotation in NQ and ES
Stock-Markets / Stock Markets 2019 Oct 01, 2019 - 08:12 AM GMTBy: Chris_Vermeulen

 We wanted to share some information that suggests the NQ (NASDAQ) and ES (S&P 500) may engage in some relatively broad market rotation over the next few weeks. Also, to share that the YM (Dow Industrials) may stay relatively flat throughout this span of time. Our Adaptive Dynamic Learning (ADL) predictive modeling system is showing somewhere between 8% to 18% or more in price movement.
The fact that our ADL predictive modeling system is suggesting the ES and NQ may rotate lower over the next few weeks and that the YM may not share the same levels of price volatility suggests that the Dow Industrials (35 stocks) may be viewed as a more solid economic base than the tech-heavy NASDAQ (100 symbols) and the various symbols within the S&P 500 (500 symbols).
It is suggesting that volatility may come from high multiple stocks or stocks that may reflect greater future economic weakness over the next 60+ days. Almost as if a transition is taking place in the markets where investors are shifting capital away from risk and into value and dividend stocks.
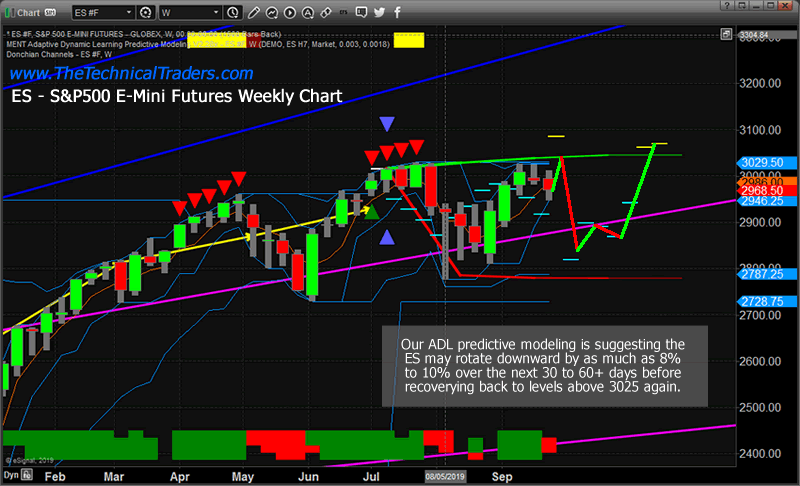
Weekly S&P 500 (ES) Chart
This Weekly S&P 500 (ES) chart highlights the ADL predictive modeling results showing the ES should attempt higher price rotation this week, the week ending the month of September, then move dramatically lower over the next 5+ weeks. Eventually, the support level above 2775 should hold as a lower price channel throughout this rotation. By the end of October, it appears the price level of the ES will setup a base near or below 2900, then begin another rally above 3050.
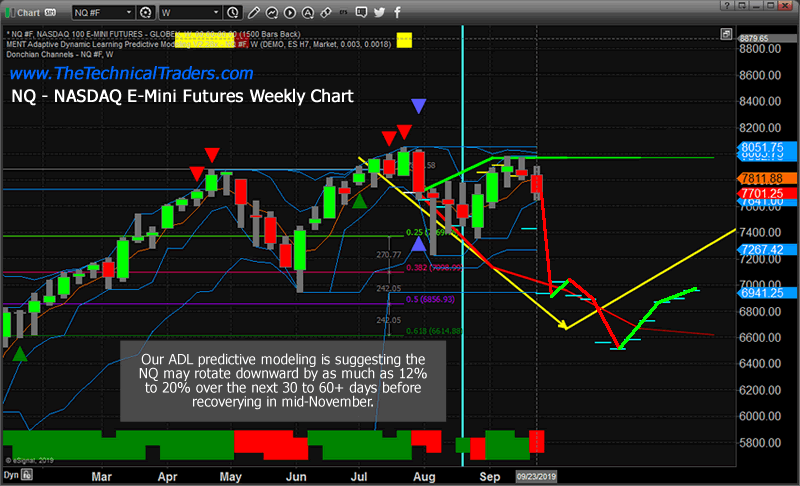
Weekly NASDAQ (NQ) ADL Chart
This Weekly NQ ADL chart highlights the broader price rotation we expect to see in the NASDAQ. The ADL predictive modeling system is suggesting the NQ will breakdown to levels below 7000 over the next 4+ weeks, potentially finding a bottom somewhere near 6500 sometime in early November. This breakdown in price would suggest the high multiple technology stocks may fall our of favor with investors as earnings and operations expectations are revalued. One thing to pay close attention to is that the ES chart appears to recover in November where the NQ chart recovery process is shown to be much lower in price level. This suggests the NQ may contract by as much as 12% to 18%, or more, throughout this rotation and that the ES may begin a recovery before the NQ attempts to find a bottom.
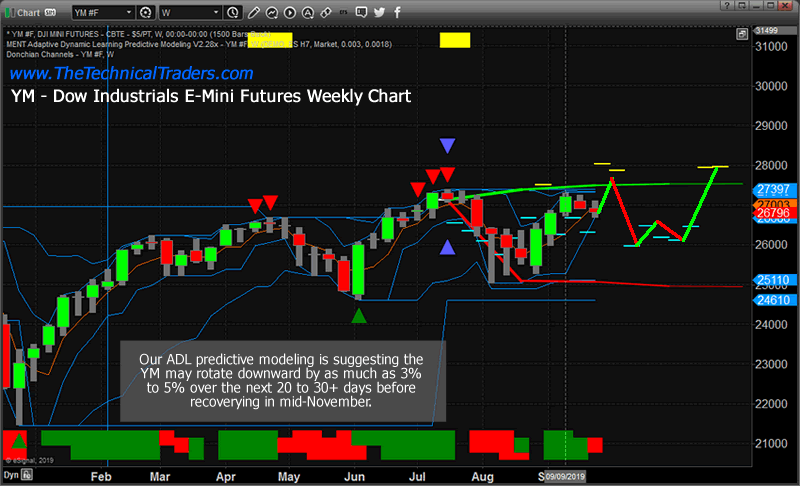
Dow Jones (YM) Weekly ADL Chart
This YM Weekly ADL chart shows that the Dow Jones Industrial sector should stay relatively immune from the type of rotation the ADL is predicting for the ES and NQ charts. The ADL system is predicting that the YM price will attempt a moderate price rally over the next 8+ days, then move lower to near the 26,000 level. At that point, price will rotate near the 26,000 level for about 4 to 5 weeks before attempting to really back above 27,500 again. This rotation constitutes only a 4% to 5% price rotation where the ES and NQ price rotations appear to be 2x to 4x that amount.
Concluding Thoughts:
When taken in total context, these ADL predictions suggest the ES and NQ will come under some extreme pricing pressures over the next 20 to 30+ days and that the NQ is the most likely to see a much deeper price correction throughout this span of time.
The ES will likely move lower throughout this expected price correction, but not as much as the NQ may fall. The YM will likely rotate a bit lower as well, possibly below 26,000 for a brief period of time. Yet the YM appears to be the most stable in terms of price volatility over the next 60 days and throughout this expected price rotation.
We believe this volatility is related to the Pennant/Flag formation that continues to setup within the broader markets. This Apex event will initiate this price rotation if price starts reverse lower below support. The shift of capital away from technology/risk is a natural price rotation as the markets setup for another attempt at new highs. The NQ may not recover to near highs before the end of 2019 based on our ADL price modeling system. It may be that the run in technology is shifting into the hunt for value, dividends, and safety.
Find out what bull and bear funds to own as we enter the final quarter of the year. This is your chance to make back what you have lost or to close out the year with oversized returns. Visit my ETF trade alert newsletter at http://www.TheTechnicalTraders.com
Chris Vermeulen
www.TheTechnicalTraders.com
Chris Vermeulen has been involved in the markets since 1997 and is the founder of Technical Traders Ltd. He is an internationally recognized technical analyst, trader, and is the author of the book: 7 Steps to Win With Logic
Through years of research, trading and helping individual traders around the world. He learned that many traders have great trading ideas, but they lack one thing, they struggle to execute trades in a systematic way for consistent results. Chris helps educate traders with a three-hour video course that can change your trading results for the better.
His mission is to help his clients boost their trading performance while reducing market exposure and portfolio volatility.
He is a regular speaker on HoweStreet.com, and the FinancialSurvivorNetwork radio shows. Chris was also featured on the cover of AmalgaTrader Magazine, and contributes articles to several leading financial hubs like MarketOracle.co.uk
Disclaimer: Nothing in this report should be construed as a solicitation to buy or sell any securities mentioned. Technical Traders Ltd., its owners and the author of this report are not registered broker-dealers or financial advisors. Before investing in any securities, you should consult with your financial advisor and a registered broker-dealer. Never make an investment based solely on what you read in an online or printed report, including this report, especially if the investment involves a small, thinly-traded company that isn’t well known. Technical Traders Ltd. and the author of this report has been paid by Cardiff Energy Corp. In addition, the author owns shares of Cardiff Energy Corp. and would also benefit from volume and price appreciation of its stock. The information provided here within should not be construed as a financial analysis but rather as an advertisement. The author’s views and opinions regarding the companies featured in reports are his own views and are based on information that he has researched independently and has received, which the author assumes to be reliable. Technical Traders Ltd. and the author of this report do not guarantee the accuracy, completeness, or usefulness of any content of this report, nor its fitness for any particular purpose. Lastly, the author does not guarantee that any of the companies mentioned in the reports will perform as expected, and any comparisons made to other companies may not be valid or come into effect.
Chris Vermeulen Archive |
© 2005-2022 http://www.MarketOracle.co.uk - The Market Oracle is a FREE Daily Financial Markets Analysis & Forecasting online publication.