


Cycles Supporting Market Consolidations
Stock-Markets / Financial Markets 2019 Oct 02, 2019 - 06:27 PM GMTBy: readtheticker

 Cycles show how regular time and price periods work within price action, they help thread the needle as to where price may move to next. Cycles with Wyckoff logic help expose how fundamentals are working through price action to motivate price to a new level. Here are some examples of cycles with other readtheticker indicators. Chart 1: If the SP500 trends higher on QE4 and gold holds up, then gold stocks should do well, and most likely out perform gold itself.
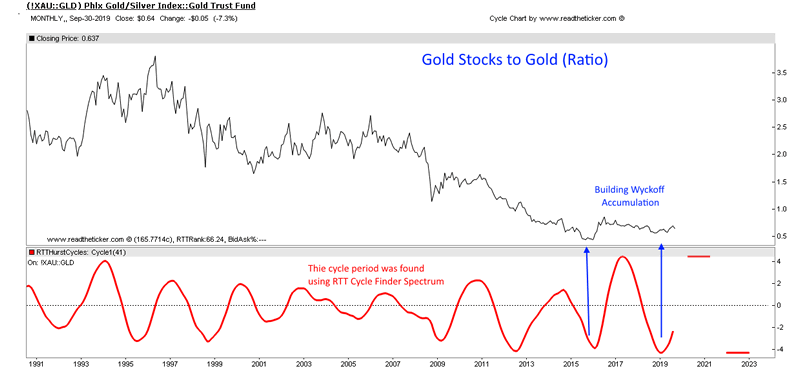
Chart 2: The dollar bulls suggest there is a dollar shortage, and as the supply of dollars is low the price should move higher as demand is high. The dollar bears say there is a large supply of dollars arriving from US deficits and QE4, hence the price will fall. Of course is a matter of timing as to which happens first. Watching and waiting.
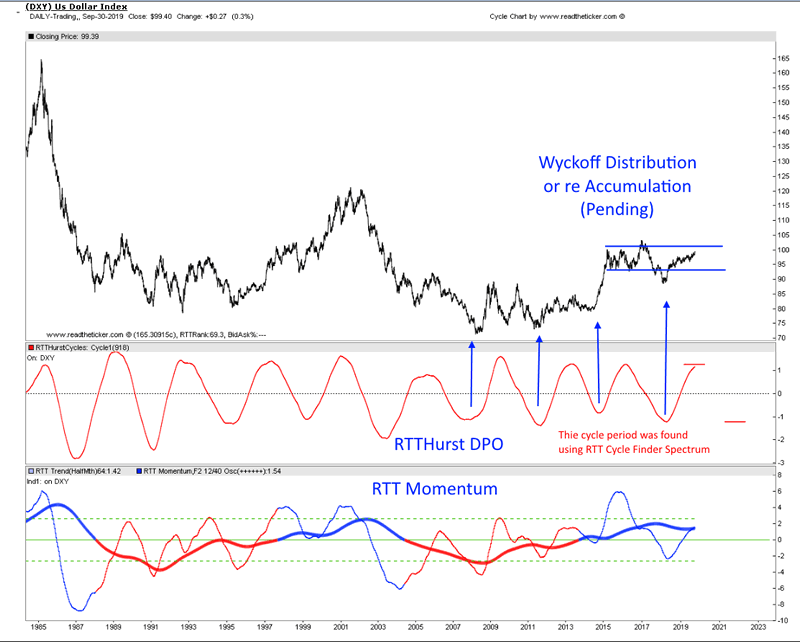
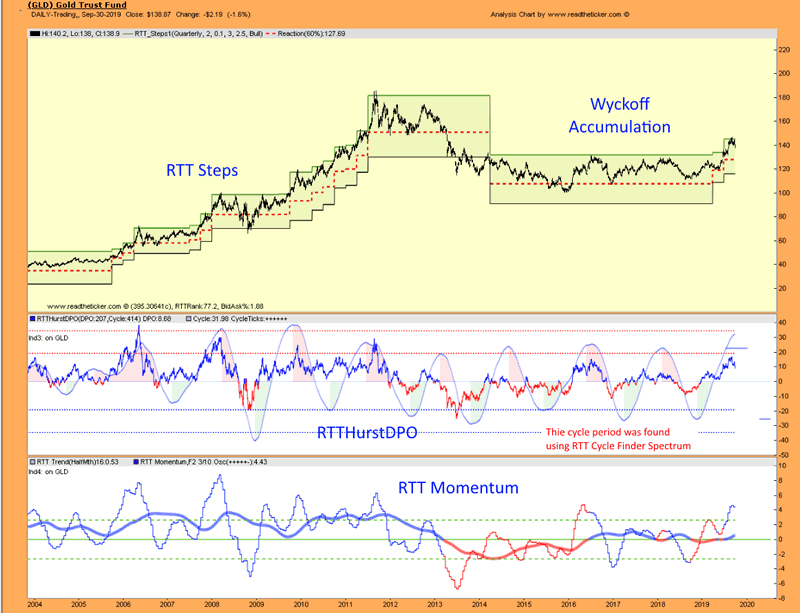
Chart 3: Gold is moving higher in line with the build of negative sovereign debt, the size of overall debt, constant money printing, US deficit risk, and elevated market risk. Cycles are working well with gold.
Fundamentals are important, and so is market timing, here at readtheticker.com we believe a combination of Gann Angles, Cycles, Wyckoff and Ney logic is the best way to secure better timing than most, after all these methods have been used successfully for 70+ years. To help you applying Richard Wyckoff and Richard Ney logic a wealth of knowledge is available via our RTT Plus membership. NOTE: readtheticker.com does allow users to load objects and text on charts, however some annotations are by a free third party image tool named Paint.net Investing
NOTE: readtheticker.com does allow users to load objects and text on charts, however some annotations are by a free third party image tool named Paint.net
Readtheticker
My website: www.readtheticker.com
We are financial market enthusiast using methods expressed by the Gann, Hurst and Wyckoff with a few of our own proprietary tools. Readtheticker.com provides online stock and index charts with commentary. We are not brokers, bankers, financial planners, hedge fund traders or investment advisors, we are private investors
© 2019 Copyright readtheticker - All Rights Reserved
Disclaimer: The material is presented for educational purposes only and may contain errors or omissions and are subject to change without notice. Readtheticker.com (or 'RTT') members and or associates are NOT responsible for any actions you may take on any comments, advice,annotations or advertisement presented in this content. This material is not presented to be a recommendation to buy or sell any financial instrument (including but not limited to stocks, forex, options, bonds or futures, on any exchange in the world) or as 'investment advice'. Readtheticker.com members may have a position in any company or security mentioned herein.
© 2005-2022 http://www.MarketOracle.co.uk - The Market Oracle is a FREE Daily Financial Markets Analysis & Forecasting online publication.