Dow Jones may have already bottomed But SP500 & Nasdaq have further to go
Stock-Markets / Stock Markets 2019 Oct 03, 2019 - 04:26 PM GMTBy: Chris_Vermeulen
 Have you been following our research? Were you prepared for this move like we were? Did you profit from this incredibly quick and volatile downside price move in the US markets? What is it going to do to the foreign markets and what next?
Our team of researchers has been all over this setup many months before it happened. In fact, we issued a research article on September 30 suggesting our predictive modeling system was warning of a big price rotation in the NQ and ES. On September 21, we authored another research article suggesting a “massive price reversion may be days or weeks away”. On September 7th, we authored yet another article suggesting “US STOCK MARKET HASN’T CLEARED THE STORM YET”
In case you missed our research, read and follow our work below. While others may have completely missed this week’s breakdown move, we called it more than 30+ days ago and provided very clear and concise information for all of our followers to know what was about to breakdown in the markets. Our morning coffee video analysis recap is the one thing… that single investment that’s going to turn into the greatest investment you’ve every made for your trading and investments.
If you find that you get analysis paralysis from reading too many articles from various news and trading sites feel free to do your self a favor just skip reading 5- 10 articles a day and being confused about what to do next get our Daily 8 Minute Technical Analysis of all the major markets and commodities. Forget the news and follow the markets with our proven technical analysis methods.
September 30, 2019: PREDICTIVE MODELING SUGGESTS BROAD MARKET ROTATION IN THE NQ & ES.
September 25, 2019: DEMOCRATS LAUNCH FORMAL IMPEACHMENT – WHAT SHOULD TRADERS EXPECT?
September 24, 2019: IS SILVER ABOUT TO BECOME THE SUPER-HERO OF PRECIOUS METALS?
September 23, 2019: IS THE TECHNOLOGY SECTOR ABOUT TO BREAK LOWER?
September 21, 2019: MASSIVE PRICE REVERSION MAY BE DAYS OR WEEKS AWAY
September 17, 2019: VIX TO BEGIN A NEW UPTREND AND WHAT IT MEANS
September 7, 2019: US STOCK MARKET HASN’T CLEARED THE STORM YET
August 30, 2019: TRANSPORTATION INDEX POINTS TO STOCK MARKETS WEAKNESS
August 13, 2019: GLOBAL CENTRAL BANKS MOVE TO KEEP THE PARTY ROLLING – PART III
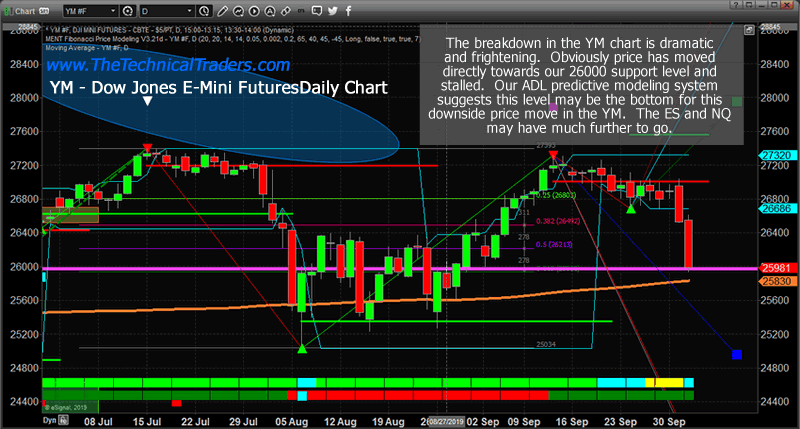
Dow Jones Daily Price Chart
Now for the really good stuff, the YM may have already reached its lowest point and may begin to form a bottom near the 26000 levels. This is the predicted downside price target level from our ADL predictive modeling system and it only took two big down-days to reach this level. We really need to pay attention to how the markets react at this point and the YM will be key to understanding if the rest of the ADL predictions about the ES and NQ are likely to play out as we suggested.

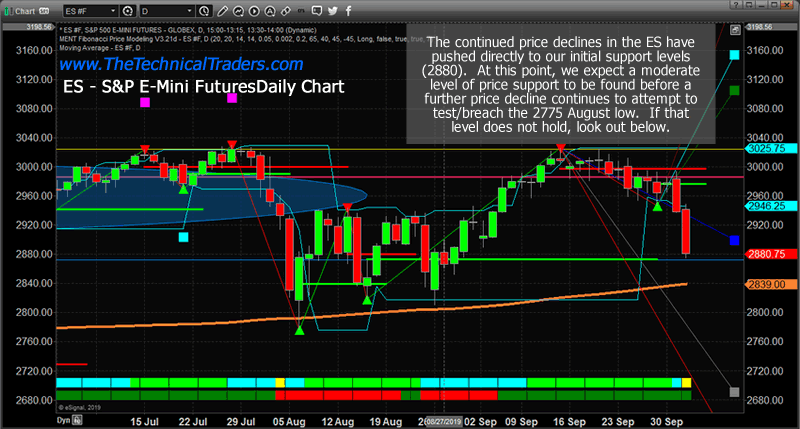
Daily SP500 Index
This ES chart highlights the downside price move to the 2880 level, our projected price target, and initial support level. At this point, the ES has fallen, just like the YM, to levels that may prompt some price support. We do believe the ES will fall further, possibly targeting the 2800 price level, before finding any real support.

Read the research articles listed in today’s research post. We’ve been well ahead of this move the entire time and we called this move perfectly using our predictive modeling systems, Fibonacci price modeling systems, and other tools. Our researchers have the ability to see into the future sometimes without predictive modeling tools.
In fact, we already have an idea of what will happen over the next 3 to 5+ years, but the price is our ultimate tool of choice. We allow price to dictate what it wants to do, then use our predictive modeling tools to align price movement with our technical and predictive analysis – that is our secret, and you can’t get it anywhere else on the planet.
As a technical analysis and trader since 1997, I have been through a few bull/bear market cycles. I believe I have a good pulse on the market and timing key turning points for both short-term swing trading and long-term investment capital. The opportunities are massive/life-changing if handled properly.
Be sure to ride my coattails as I navigate these financial markets and build wealth while others lose nearly everything they own during the next financial crisis. Join Now and Get a Free 1oz Silver Round or Gold Bar and SPECIAL OFFER TODAY ONLY – CLICK HERE
I can tell you that huge moves are about to start unfolding not only in metals, or stocks but globally and some of these supercycles are going to last years. This quick and simple to understand guide on trading with technical analysis will allow you to follow the markets closely and trade with it. Never be caught on the wrong side of the market again and suffer big losses. PDF guide: Technical Trading Mastery
Chris Vermeulen
www.TheTechnicalTraders.com
Chris Vermeulen has been involved in the markets since 1997 and is the founder of Technical Traders Ltd. He is an internationally recognized technical analyst, trader, and is the author of the book: 7 Steps to Win With Logic
Through years of research, trading and helping individual traders around the world. He learned that many traders have great trading ideas, but they lack one thing, they struggle to execute trades in a systematic way for consistent results. Chris helps educate traders with a three-hour video course that can change your trading results for the better.
His mission is to help his clients boost their trading performance while reducing market exposure and portfolio volatility.
He is a regular speaker on HoweStreet.com, and the FinancialSurvivorNetwork radio shows. Chris was also featured on the cover of AmalgaTrader Magazine, and contributes articles to several leading financial hubs like MarketOracle.co.uk
Disclaimer: Nothing in this report should be construed as a solicitation to buy or sell any securities mentioned. Technical Traders Ltd., its owners and the author of this report are not registered broker-dealers or financial advisors. Before investing in any securities, you should consult with your financial advisor and a registered broker-dealer. Never make an investment based solely on what you read in an online or printed report, including this report, especially if the investment involves a small, thinly-traded company that isn’t well known. Technical Traders Ltd. and the author of this report has been paid by Cardiff Energy Corp. In addition, the author owns shares of Cardiff Energy Corp. and would also benefit from volume and price appreciation of its stock. The information provided here within should not be construed as a financial analysis but rather as an advertisement. The author’s views and opinions regarding the companies featured in reports are his own views and are based on information that he has researched independently and has received, which the author assumes to be reliable. Technical Traders Ltd. and the author of this report do not guarantee the accuracy, completeness, or usefulness of any content of this report, nor its fitness for any particular purpose. Lastly, the author does not guarantee that any of the companies mentioned in the reports will perform as expected, and any comparisons made to other companies may not be valid or come into effect.
Chris Vermeulen Archive |
© 2005-2022 http://www.MarketOracle.co.uk - The Market Oracle is a FREE Daily Financial Markets Analysis & Forecasting online publication.


