


Silver Is Cheap – And Getting Cheaper
Commodities / Gold & Silver 2019 Oct 07, 2019 - 03:58 PM GMTBy: Kelsey_Williams

 Silver is definitely cheap. By almost any standard of measurement, the price of silver is cheap. It is cheap relative to gold, it is cheap compared to its recent peak in 2011, and it is cheap historically. For some, that apparently means that silver is a bargain, too. I’m not so sure.
Those who tell us silver is cheap relative to gold say that silver’s price is likely to rise higher, relative to gold, going forward.
But a currently higher gold-to-silver ratio could also drop, favoring silver relative to gold, even if prices for both declined from here, rather than moving higher. In that case, silver’s price would not drop as much relative to gold.
There is no fundamental basis for any expectations regarding price action of silver relative to gold, though. The fundamentals for each are different. You can read more about the gold-to-silver ratio in my article Gold-Silver Ratio: Debunking the Myth.
We certainly know that silver is cheaper than it was in 2011. Silver’s price peaked in April 2011 at $49.50. Silver closed the other day – September 30, 2019 – at $16.95. That is a net decline of more then sixty-five percent.
Silver is cheaper today than it was in 1980, too. In January 1980, silver’s price peaked at just under $49.00. In fact, silver’s intraday price peaks in January 1980 and April 2011 are almost identical. Stopping short of the $50.00 mark the second time around was not positive.
The chart below depicts a one-hundred year price history for silver. The dates we referred to earlier are indicated on the chart…
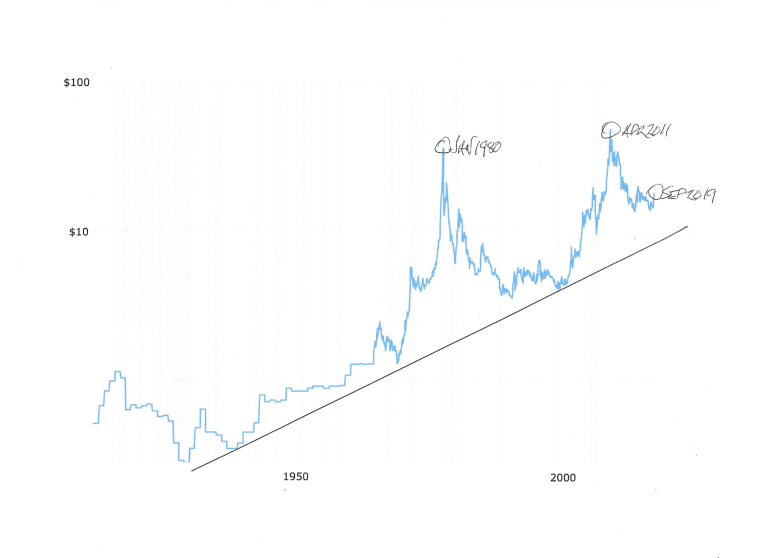
100-Year History Of Silver Prices (source)
On the chart it appears that silver’s price has been in a long-term uptrend going back to 1932, when silver was $0.28 (twenty-eight cents) per ounce. Silver could fall all the way back to $10.00 or less without violating that uptrend line of support.
However, that does not show us that silver is getting cheaper over time. Here is a second chart that gives a different impression…
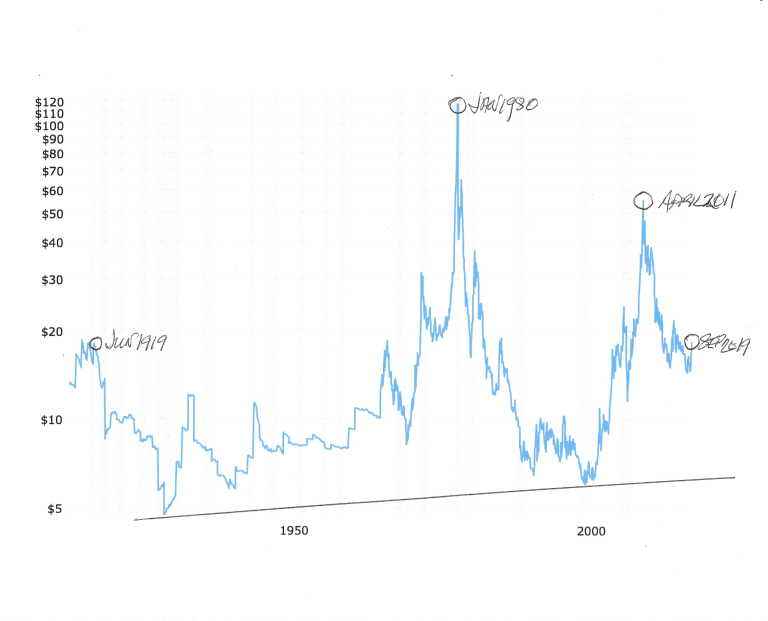
The above chart is the same 100-year history of silver prices on an inflation-adjusted basis. Now we see that silver today is also cheaper than it was one hundred years ago, in June 1919.
Except for two brief periods of ten years (1974-84) and four years (2010-14), silver has traded below its price of Jun 1919 for the past century. Eighty-six years out of one hundred years at lower silver prices, not higher.
Price action in silver is so pathetic that it does not come close to matching inflation. For that to be the case, silver would need to be anywhere from fifty to seventy times higher than it was in 1919. In other words, the price of silver should be at least $60.00 per ounce – today!
For silver to have matched gold’s price increases (which reflect the decline in purchasing power of the US dollar), it would need to be $90.00 per ounce right now.
When silver peaked at close to $50.00 per ounce in 2011, it represented an inflation-adjusted decline from its peak near that same price thirty-one years earlier. That decline amounted to more than fifty percent. And, with silver today at $17.00 per ounce, it is now cheaper by eighty-five percent from its peak in January 1980.
Also, the uptrend line of support in the second chart is not nearly as steep as in the first chart. As a result, the price of silver could fall below $7.00 and still remain above the line of support.
Now, lets look back at both charts again.
Silver’s century-long uptrend looks very positive in the first chart. But, in real terms, adjusted for inflation, as shown in the second chart, silver seems well-contained under $20.00 per ounce.
The longer you wait, the cheaper it gets. Don’t be too shocked if silver is trading under $10.00 per ounce within a few years; maybe even sooner. (also see Silver’s Next Big Move)
By Kelsey Williams
http://www.kelseywilliamsgold.com
Kelsey Williams is a retired financial professional living in Southern Utah. His website, Kelsey’s Gold Facts, contains self-authored articles written for the purpose of educating others about Gold within an historical context.
© 2019 Copyright Kelsey Williams - All Rights Reserved Disclaimer: The above is a matter of opinion provided for general information purposes only and is not intended as investment advice. Information and analysis above are derived from sources and utilising methods believed to be reliable, but we cannot accept responsibility for any losses you may incur as a result of this analysis. Individuals should consult with their personal financial advisors.
© 2005-2022 http://www.MarketOracle.co.uk - The Market Oracle is a FREE Daily Financial Markets Analysis & Forecasting online publication.