Stock Market Short-term Consolidation Does Not change Secular Bullish Trend
Stock-Markets / Stock Markets 2019 Oct 11, 2019 - 03:09 PM GMTBy: Donald_W_Dony
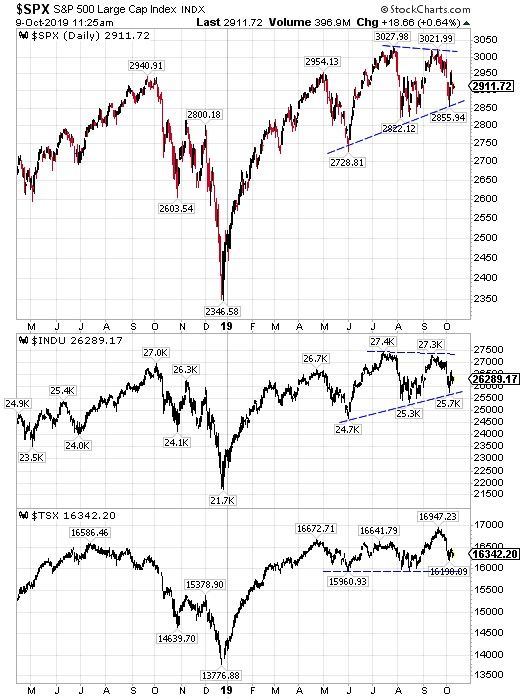
 The on-again, off-again, on-again Trump trade war with China coupled with weakening signs of U.S. economic growth has placed the S&P 500 into another multi-month consolidation.
Stocks continue to gyrate from mid-year as news of a possible trade deal appears to solidify only to have a reverse decision suddenly develop.
This whip-sawing creates uncertainty among traders. As such, the S&P 500 and Dow Jones Industrial Average has remained in a 10% trading band over the last six months, whereas the Canadian TSX has been held in a tighter 6% trading range (Chart 1).

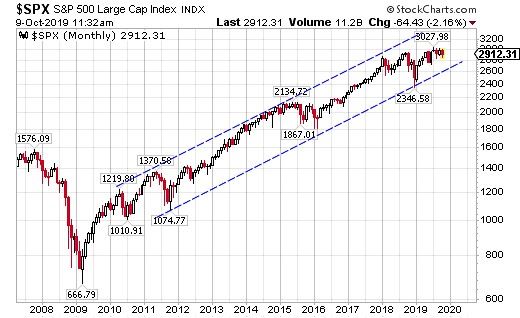
Regardless of short-term concerns, the longer-term picture continues to illustrate a strong secular bull market (Chart 2).

Throughout the many political and economic developments that have occurred in the past 10 years, the benchmark S&P 500 has steadily advanced. The index has marched upward over 300% since 2009. This steady rise from the U.S. index has eclipsed most world markets. For example, the MSCI World (ex USA) Index has only managed to climb about 100% in the last 10 years.
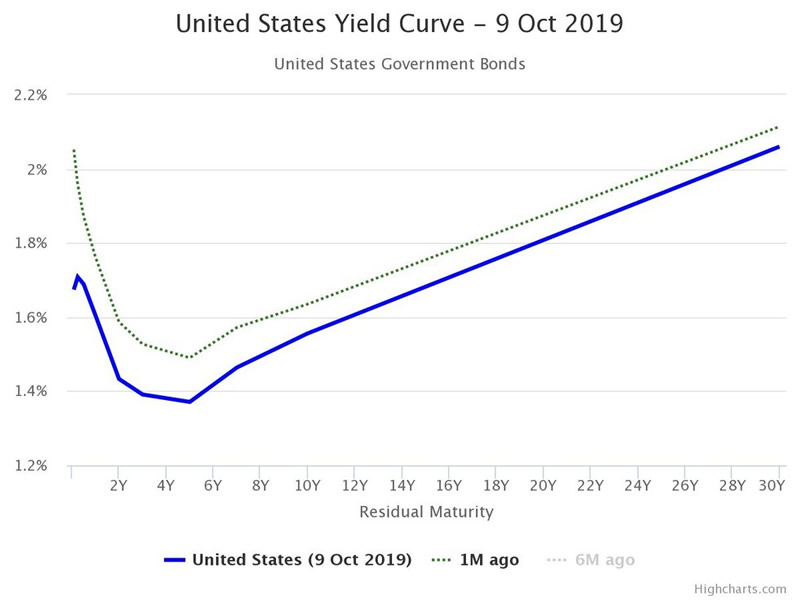
One of the most reliable indicator of the health of the U.S. economy and stock market is the U.S. Yield Curve (Chart 3). This key economic gauge has identified virtually every bear market since its creation in the 1940s.

The Yield Curve was flashing a short-term warning sign in September with 3 to 6 months rates rising to equal 20 and 30 year rates. However, that phase has ended. Short-term rates are now below long-term yields and positioning the curve in a normal bullish stance.
Bottom line: The short-term range-bound stance of the S&P 500, Dow and TSX is expected to continue into Q4. Negative issues surrounding the White House's trade war with China have been tempered with the new impeachment inquiry of Donald Trump. These issues will undoubtedly weigh on traders and reflect on a more neutral protective stance. Irregardless, the secular bull market is showing no signs of weakness. Models are suggesting the new mid-year targets or the S&P 500 is 3200. For the Dow, 29,100 and for the TSX, 17,750.
By Donald W. Dony, FCSI, MFTA
www.technicalspeculator.com
COPYRIGHT © 2019 Donald W. Dony
Donald W. Dony, FCSI, MFTA has been in the investment profession for over 20 years, first as a stock broker in the mid 1980's and then as the principal of D. W. Dony and Associates Inc., a financial consulting firm to present. He is the editor and publisher of the Technical Speculator, a monthly international investment newsletter, which specializes in major world equity markets, currencies, bonds and interest rates as well as the precious metals markets.
Donald is also an instructor for the Canadian Securities Institute (CSI). He is often called upon to design technical analysis training programs and to provide teaching to industry professionals on technical analysis at many of Canada's leading brokerage firms. He is a respected specialist in the area of intermarket and cycle analysis and a frequent speaker at investment conferences.
Mr. Dony is a member of the Canadian Society of Technical Analysts (CSTA) and the International Federation of Technical Analysts (IFTA).
Donald W. Dony Archive |
© 2005-2022 http://www.MarketOracle.co.uk - The Market Oracle is a FREE Daily Financial Markets Analysis & Forecasting online publication.


