Gold, Silver Bonds - Inflation in the Offing?
Commodities / Gold & Silver 2019 Oct 14, 2019 - 12:19 PM GMTBy: Gary_Tanashian
 Let’s take a look at some indicators that can come together to let us know when the next inflationary bout is in the offing.
The spread between 10yr and 2yr yields (the most commonly watched yield spread/curve) is still steepening on the short-term. Live chart available here.
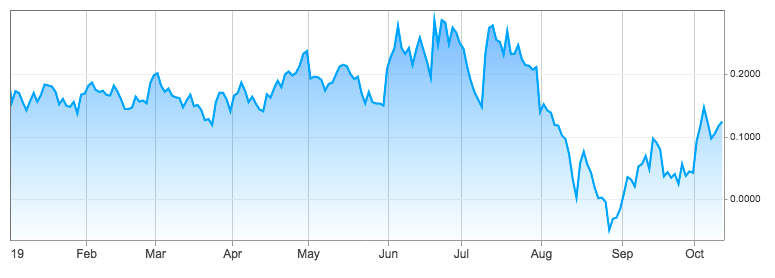
What’s more, it is doing this against a short-term bounce in yields (my TBT positions appreciate that) and that would be an inflationary indication. Not a trend, an early indication.
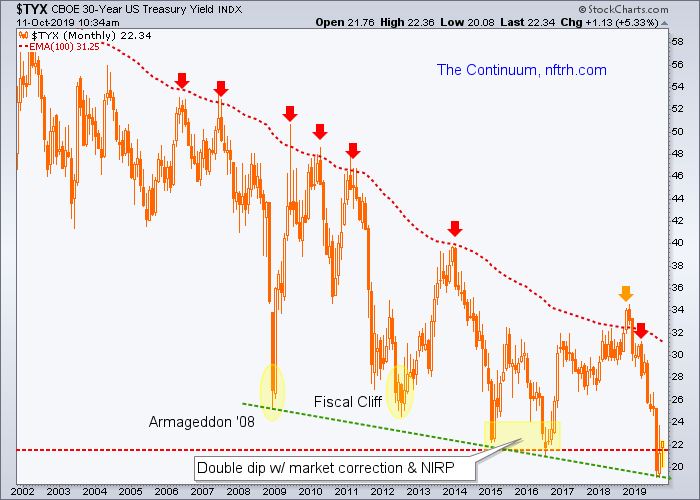
Indeed, the Continuum is once again climbing above the key 2.2% level.*
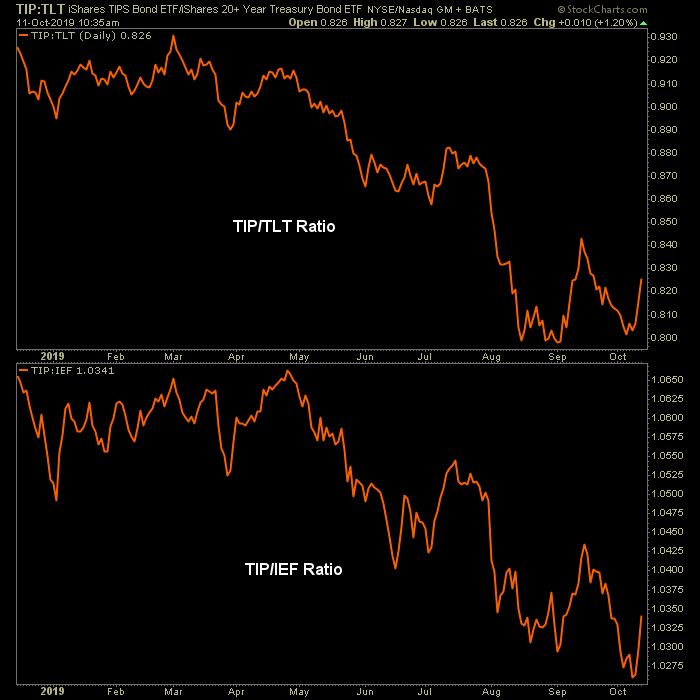
TIP/TLT and TIP/IEF, commonly thought of as inflation expectations gauges, are bouncing but not yet on a trend change to inflationary. Daily chart…
As Industrial Metals continue to bounce vs. Gold and Palladium continues to bull against Gold (as of yesterday; the chart would be even more constructive if updated as of today). As with the charts above, the signal is preliminary, however, as the major trends in Copper & Industrial Metals vs. Gold are still down.
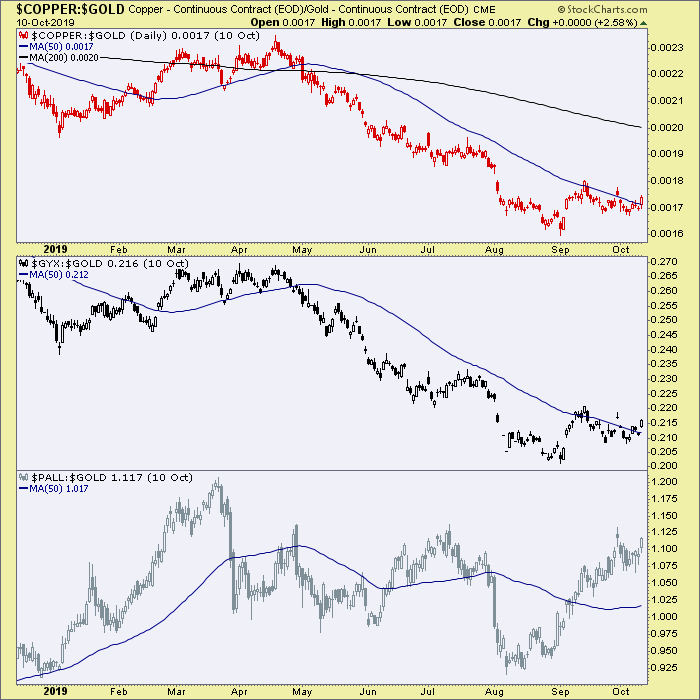
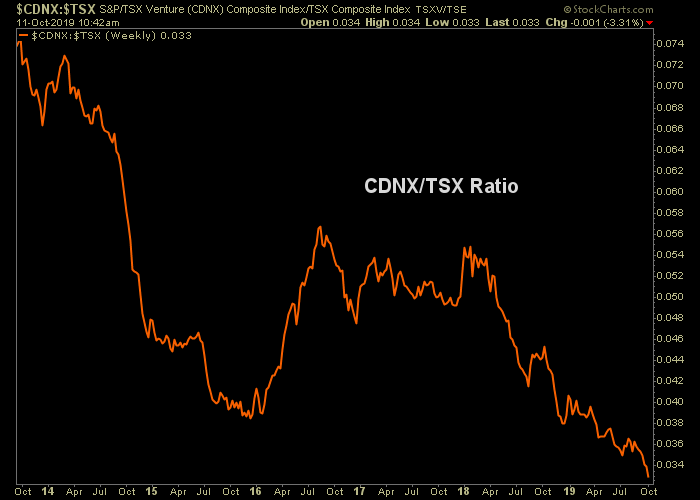
Here is a curious one. The ratio of Canada’s speculative index vs. its senior index tends to go in line with US inflation expectations.
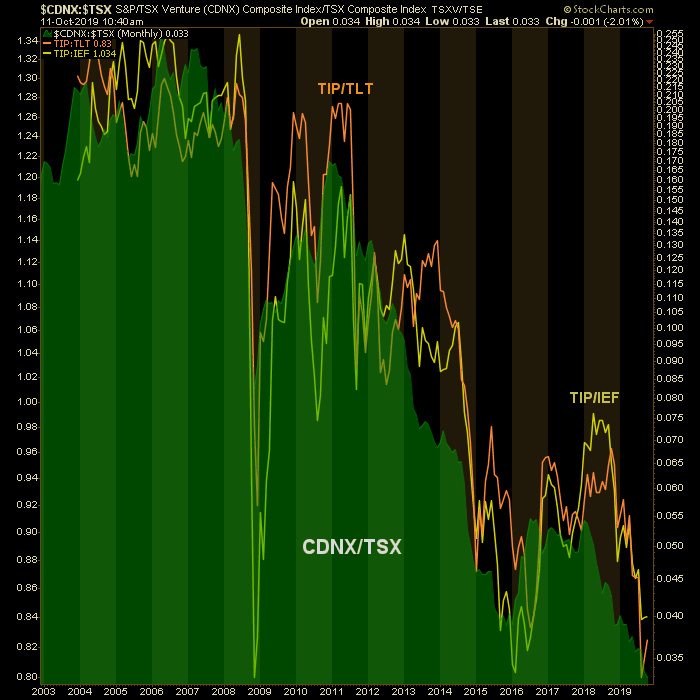
Yet the ratio is burrowing to new lows. Either the inflation bounce is going to fail or there are going to be some washout bull trades showing up out there in Canada’s speculative patch.
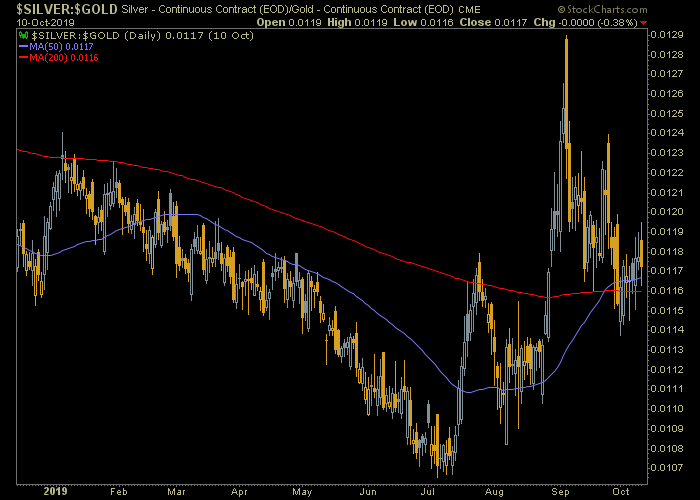
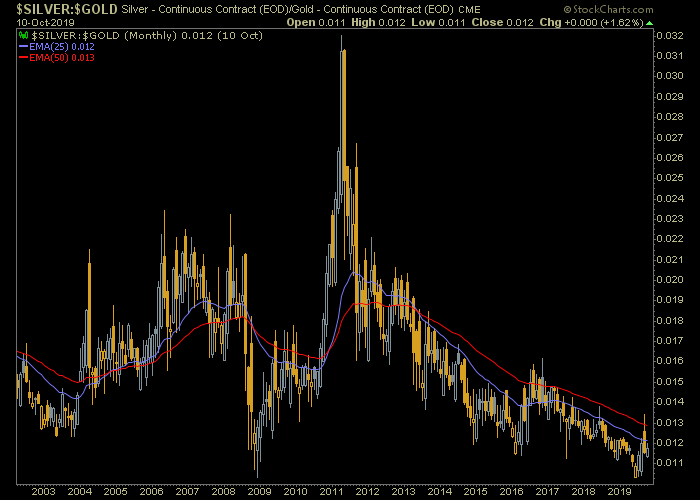
Finally, the Silver/Gold ratio holds its constructive stance on a daily chart. As Silver has more cyclical commodity-like characteristics than Gold, it would indicate toward inflation by rising.
The problem being that the larger trend (monthly chart) has not been turned up yet.
Bottom Line
Cyclical markets are rallying today and a happy presidential tweet explains why.

Now, are markets being driven on the ability of the US and China to reach lasting agreements on trade? In the short-term, sure, this is among the drivers.
But if indeed the two super economic powers kiss and make up, cyclical inflationary forces gather, our positive readings on the leading Semiconductor sector prove to be real as they were in 2013, the negatives gathering in US manufacturing dissipate (which could be aided by a weaker US dollar, which itself could be instigated by a dovish Fed should it decide to go that route) the macro would transition inflationary.
Unfortunately, with the trade hype as fresh as ever the indications are not yet definitive. But a road map is in place.
* Unlike the thesis put forth in this post, I am not necessarily expecting a “great” inflation, if it materializes. A simple rise to the Continuum’s monthly EMA 100 (limiter) would do the trick.
Subscribe to NFTRH Premium (monthly at USD $35.00 or a discounted yearly at USD $365.00) for an in-depth weekly market report, interim market updates and NFTRH+ chart and trade setup ideas, all archived/posted at the site and delivered to your inbox.
You can also keep up to date with plenty of actionable public content at NFTRH.com by using the email form on the right sidebar and get even more by joining our free eLetter. Or follow via Twitter ;@BiiwiiNFTRH, StockTwits or RSS. Also check out the quality market writers at Biiwii.com.
By Gary Tanashian
© 2019 Copyright Gary Tanashian - All Rights Reserved
Disclaimer: The above is a matter of opinion provided for general information purposes only and is not intended as investment advice. Information and analysis above are derived from sources and utilising methods believed to be reliable, but we cannot accept responsibility for any losses you may incur as a result of this analysis. Individuals should consult with their personal financial advisors.
Gary Tanashian Archive |
© 2005-2022 http://www.MarketOracle.co.uk - The Market Oracle is a FREE Daily Financial Markets Analysis & Forecasting online publication.


