


What's Wrong With The Stock Market Smart Money?
Stock-Markets / Stock Markets 2019 Oct 23, 2019 - 04:27 PM GMTBy: Troy_Bombardia

Jason Goepfert writes: Another one bites the dust
The Conference Board’s Leading Economic Index® is a popular indicator to watch for potential recessions ahead, and the latest reading shows a 2nd consecutive drop month-over-month.
The LEI hasn’t gone much of anywhere for a year, showing signs of plateauing. Its Bollinger Band has tightened to a near-record degree, showing that the index has flattened out over the past year.
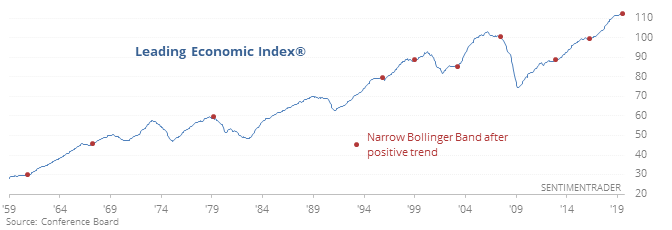
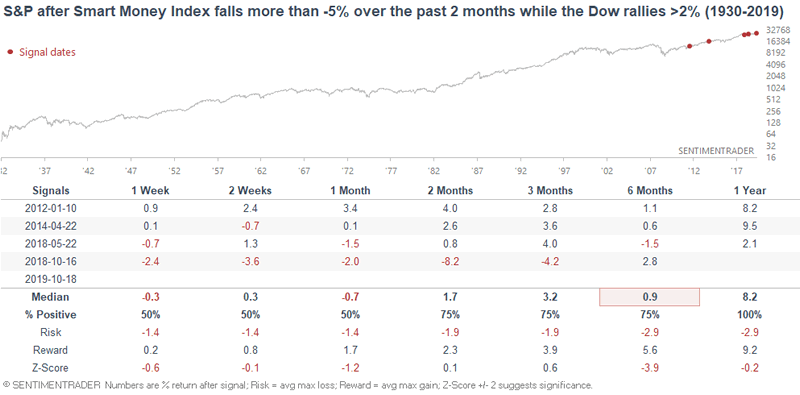
Using a long time frame, we can see still that it was not a successful “get out now” signal for stocks. Across most time frames, the S&P was negative only once or twice, and overall average returns and risk/reward were better than random. There was a definite bias toward staples stocks and away from discretionary ones, however.
Smart Money Flow Index
The Smart Money Flow Index (or Smart Money Index) is based on the premise the "smart money" trades at the end of the day while "dumb money" trades at the start of the day. This indicator particularly catches traders' attention when it goes down (headline: SMART MONEY IS SELLING).
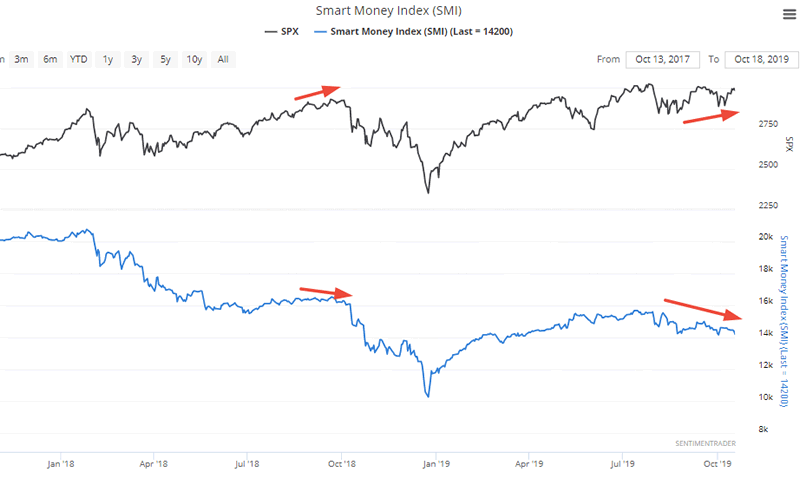
Despite its popularity and catchy name, it hasn't been particularly useful for timing purposes. The premise that "smart money trades at the end of the day" is increasingly not true, due to the popularity of ETFs.
By Troy Bombardia
Copyright 2019 © Troy Bombardia - All Rights Reserved
Disclaimer: The above is a matter of opinion provided for general information purposes only and is not intended as investment advice. Information and analysis above are derived from sources and utilising methods believed to be reliable, but we cannot accept responsibility for any losses you may incur as a result of this analysis. Individuals should consult with their personal financial advisors.
© 2005-2022 http://www.MarketOracle.co.uk - The Market Oracle is a FREE Daily Financial Markets Analysis & Forecasting online publication.