


Silver & Gold to Inform Dr. Copper and so, the Macro
Commodities / Gold & Silver 2019 Oct 26, 2019 - 02:36 PM GMTBy: Gary_Tanashian

 They call copper the metal with the Ph.D. in Economics. But these days Doctor Copper is little more than a quack in that regard, taking a cue from the metals whose interplay will be critical to deciding the coming macro for 2020 and the run up to the next US election. Thus, they are the 3 Metallic Amigos, riding together but providing different signals at different times (this being nftrh.com, you will have to put up with the odd shtick from time to time).
As we have noted repeatedly, the Silver/Gold ratio takes it place alongside other indicators (like long-term Treasury yields, yield curve, TIPs ratios, inflation breakevens, etc.) of a would-be inflationary environment. When silver (more cyclical, commodity-like characteristics) rises vs. gold (more counter-cyclical, liquidity haven characteristics) it is a hint toward an inflationary macro.
A daily chart of silver/gold shows a constructive ratio at yesterday’s close and this morning in pre-market silver is +2.77% while gold is +.77%. The implication could well be an end to the current bull flag consolidation at the moving averages and the next upturn in silver/gold, the miners and possibly the inflation/reflation trades that tend to follow.
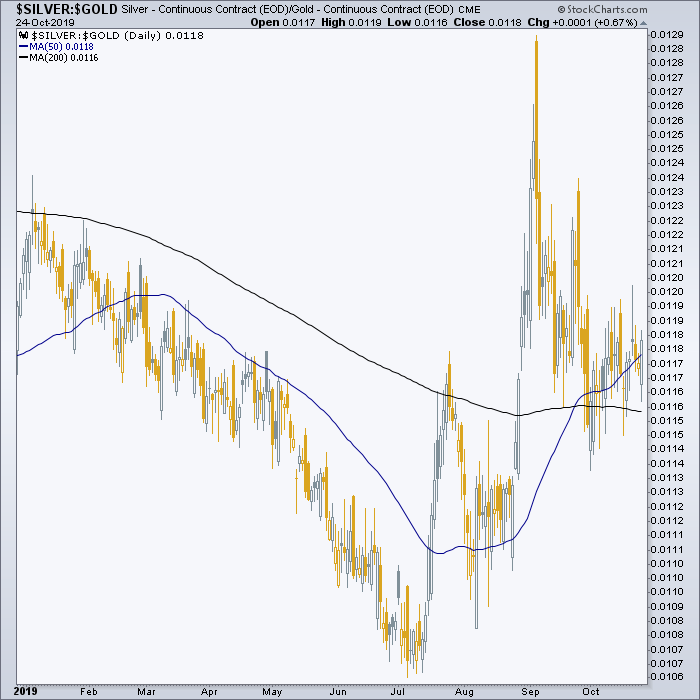
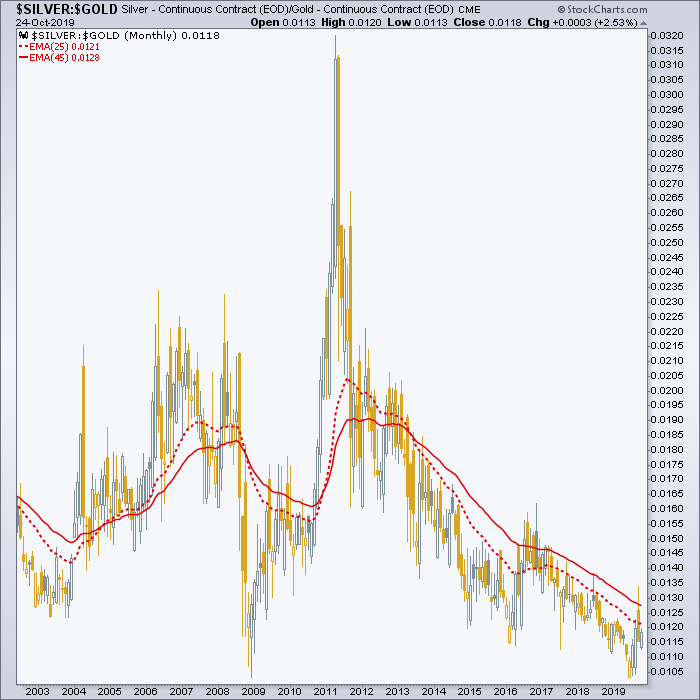
But with FOMC week dead ahead and the Algos tendency to create all sorts of havoc in its wake, let’s stay grounded for the time being, shall we? Silver/Gold above is quite constructive, but its monthly chart is still trending down.
On a related matter, we had an NFTRH update on Wednesday noting among other things about the HUI Gold Bugs index…
“The longer the correction has gone on the more it has moved from the look of a minor topping pattern to a potential consolidation pattern, with the overbought readings addressed through both price and time. Personally, I feel well corrected even though I have retained the majority of profits. That is because of the time element and the mental grind of hedging, balancing and analyzing this thing since August.
It’s a volatile but orderly correction that has retraced 38% of the previous rally and not even touched the first short-term support area yet. The problem for a bear or for those of us who’d like a buying opportunity at HUI 180 is that for a long while now, every gold bug and his brother has known about the correction. Back in August they were greedy. In September they were still spirited. Here in late October, they’ve been dulled and muted at best. That’s not bearish.”
It is now a few minutes after the open (Oct. 25). GDX and GDXJ have gapped up to the underside of the SMA 50s and the September bounce highs, and are not yet out of the corrective woods. But the move is strong thus far (HUI has gapped above its SMA 50).
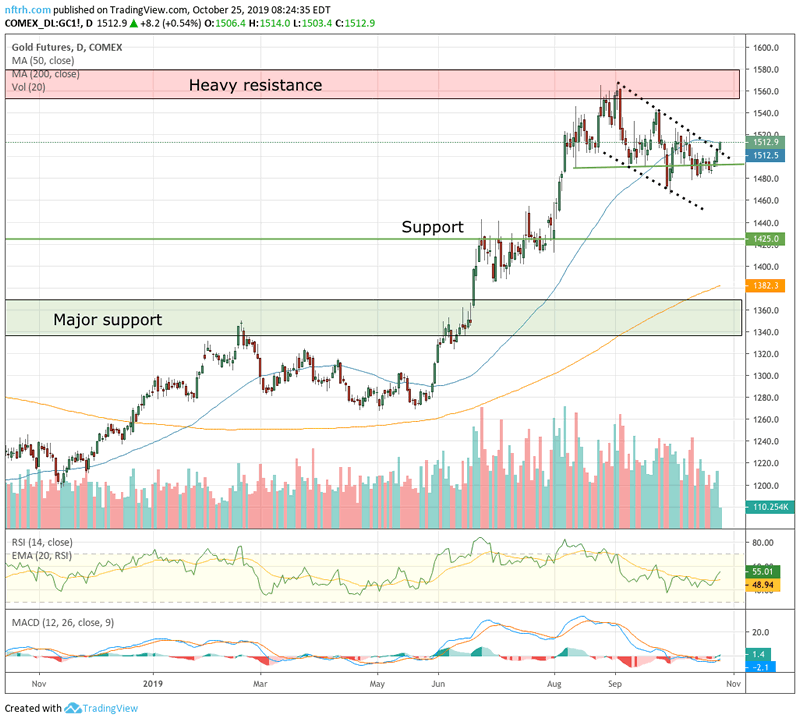
Let’s move on to the nominal futures charts of each of the 3 Metallic Amigos, to see how they look in real time (of this post). You can click these futures charts for a larger, clearer view.
Gold has nosed out of its downtrend channel/bull flag after halting at and declining from the expected resistance zone. It is testing the underside of the SMA 50, which appears an important obstacle. I have been favoring a pullback to 1425 support, but if this channel break is real that may not come about.
I have a long-term holding in gold, have been adding back gold stocks slowly, hold several of them and we chart several more quality situations in NFTRH each week.
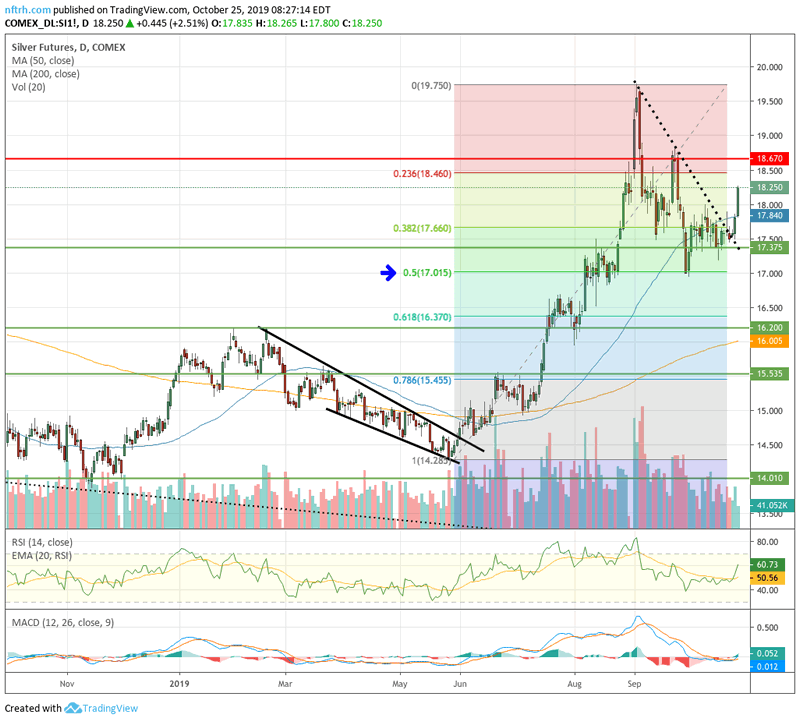
Silver did great work on the correction after it exceeded our original upside resistance target for a couple of days and then did a belly flop all the way to the 50% Fib retrace area (blue arrow). While we have had the low 16s open as a potential correction low, the work already done qualifies as a solid correction. You’ll note that silver has with great vigor broken a downward trend line of its own. I am long SLV, a couple of silver miners and we are charting several more in NFTRH each week.
But if the Silver/Gold ratio guides the macro to an inflationary 2020 there will likely be many more players in this trade. Key global markets, commodities and resources would participate. That is where Doctor Copper, as directed by Silver/Gold, would finally play his hand or write his prescription if you will.
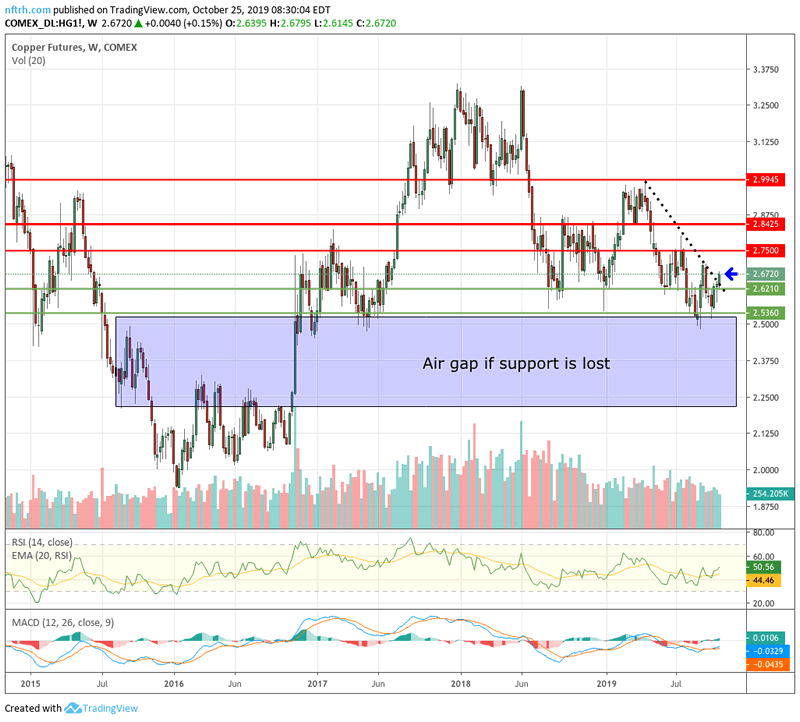
A weekly chart works best in copper’s case. The blue arrow shows a break of a trend line and a break through a resistance level, now support. It may not look like much, but as copper remained in the 2.50 area it was vulnerable to the big time gap (i.e. absence of support until 2.20 or so). That area has been emblematic of what I’d favored as a potentially bearish Q4 2019 prior to an inflationary – and potentially bullish – 2020.
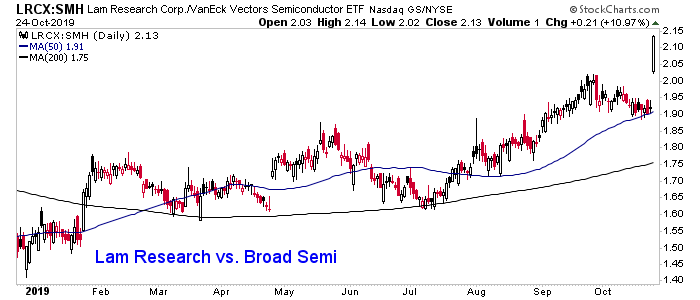
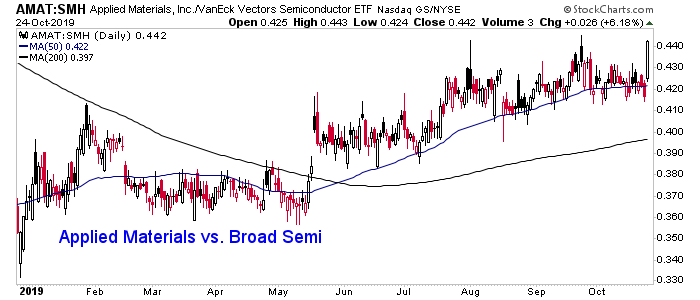
Our alternate view has been for the inflation signals to bubble up in Q4 2019. If Silver/Gold turns up and copper holds up these signals could join the already bullish signs we’ve been noting consistently in 2019 coming from the Semiconductor sector to indicate a cyclical inflation trade, into what will be a very contentious and blood soaked election year in the US.
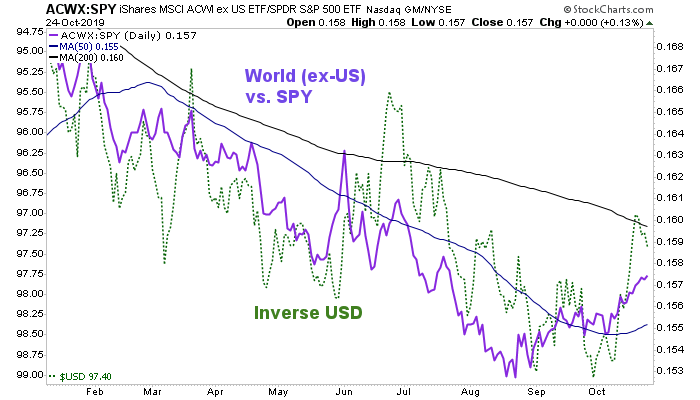
In that event the US dollar would probably weaken and global stocks would gain an advantage over US markets as the World (ex-US) and inverse USD generally travel together.
A bearish Q4 2019 is not off the table just yet, but the Silver/Gold ratio will be among the indicators that could disqualify it. Meanwhile, here comes Halloween, Thanksgiving, Christmas and the whole raft of holidays, year-end bonuses, tax loss selling (and January effect buying). In short, it may be the spooky season, but it’s also the interesting season in the markets. Big changes could come sooner (Q4) or later H1 2020. Watch early indicators, like Silver/Gold.
Subscribe to NFTRH Premium (monthly at USD $33.50 or a 14% discounted yearly at USD $345.00) for an in-depth weekly market report, interim market updates and NFTRH+ chart and trade setup ideas, all archived/posted at the site and delivered to your inbox.
You can also keep up to date with plenty of actionable public content at NFTRH.com by using the email form on the right sidebar and get even more by joining our free eLetter. Or follow via Twitter ;@BiiwiiNFTRH, StockTwits or RSS. Also check out the quality market writers at Biiwii.com.
By Gary Tanashian
© 2019 Copyright Gary Tanashian - All Rights Reserved
Disclaimer: The above is a matter of opinion provided for general information purposes only and is not intended as investment advice. Information and analysis above are derived from sources and utilising methods believed to be reliable, but we cannot accept responsibility for any losses you may incur as a result of this analysis. Individuals should consult with their personal financial advisors.
Gary Tanashian Archive |
© 2005-2022 http://www.MarketOracle.co.uk - The Market Oracle is a FREE Daily Financial Markets Analysis & Forecasting online publication.