


These Indicators Aren’t Putting to an Economic Resurgence
Economics / US Economy Nov 06, 2019 - 04:40 PM GMTBy: Harry_Dent

 When David Stockman spoke at our IES conference in October, he had a whole slew of charts that showed that the main street economy had nothing to do with the Wall Street one – and that there were more signs of weakening growth than strengthening.
He recently showed some updates and these were the two that most caught my eye. Both of these are from the more cyclical sectors that most often cause recessions.
Look at the year-over-year change in Industrial Production.
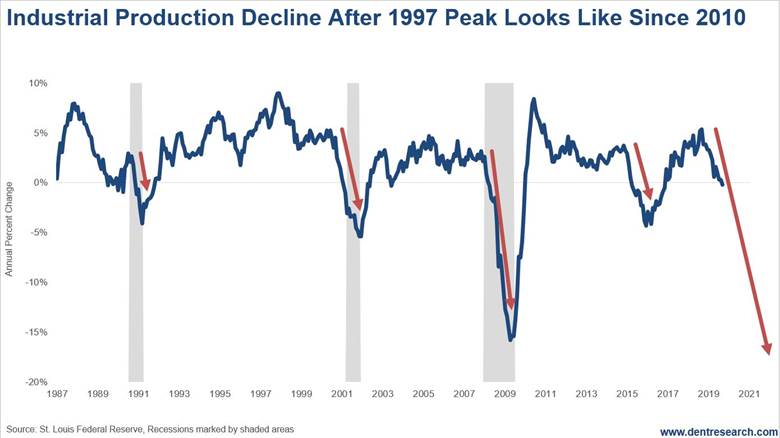
Industrial Production Decline
This indicator just crossed zero again and would suggest a recession sometime next year. More interesting to me is the overall pattern. The first peak came in late 1997. It was followed by a modest fall into 1998 and then a tepid bounce into early 2000. Then came a more substantial decline into the mild recession of 2001 to -6%. And then a bigger, longer bounce back to positive, followed by the dramatic decline to -16% into the great recession into the latter part of 2009.
The final bottom came almost 12 years after the peak.
The next peak came very sharply with the dramatic first QE steroid shot into mid-2010 That was followed by a mild drop and more sideways bounce into 2014. Then there was a larger drop to -5% into early 2016 – a near recession, now that QE was countering any such thing. Then a bounce back positive again and now a potentially final drop that has already crossed zero.
I fully expect this decline to go much lower than the last one at -16% to 20-25%+. A 12-year lag on the 2010 peak would put this bottom into 2022. I expect late 2022+.
Construction Spending
The next indicator has more of a megaphone pattern with slightly higher highs and progressively lower lows – mimicking the pattern I have been seeing in the stock markets, longer and shorter term.
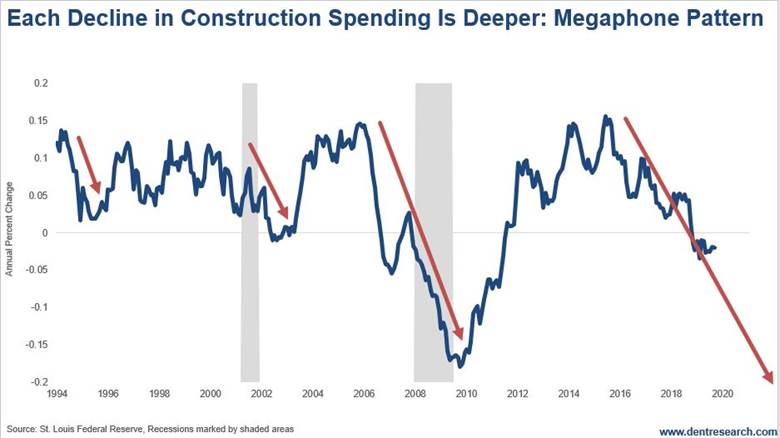
There was a modest dip in construction that didn’t go negative from 1994 into 1995. After a rebound into late 1999, the next dip came into mid-2002 and went to -1% in that mild recession. And then there was another slight new high into late 1995 (when I called for a housing bubble top) and then the dramatic plunge down to -18% from late 1995 into 2009.
Since, we have seen another slightly higher growth peak in 2018 and a decline that has thus far fallen to -3%. A lower low this time would suggest a plunge to -25%+!!!
So, the big question is: When do the ever-optimistic “markets on crack” get the picture?
Harry
Follow me on Twitter @HarryDentjr
P.S. Another way to stay ahead is by reading the 27 simple stock secrets that our Seven-Figure Trader says are worth $588,221. You’ll find the details here.
Harry studied economics in college in the ’70s, but found it vague and inconclusive. He became so disillusioned by the state of the profession that he turned his back on it. Instead, he threw himself into the burgeoning New Science of Finance, which married economic research and market research and encompassed identifying and studying demographic trends, business cycles, consumers’ purchasing power and many, many other trends that empowered him to forecast economic and market changes.
Copyright © 2019 Harry Dent- All Rights Reserved Disclaimer: The above is a matter of opinion provided for general information purposes only and is not intended as investment advice. Information and analysis above are derived from sources and utilising methods believed to be reliable, but we cannot accept responsibility for any losses you may incur as a result of this analysis. Individuals should consult with their personal financial advisors.
© 2005-2022 http://www.MarketOracle.co.uk - The Market Oracle is a FREE Daily Financial Markets Analysis & Forecasting online publication.