


How Do YOU Know the Direction of a Market's Larger Trend?
Commodities / Commodities Trading Nov 09, 2019 - 03:28 PM GMTBy: EWI

 Fundamental analysis versus Elliott wave analysis: the winner for predicting the 9-year long commodity bear market is clear.
95% of traders fail. It's a day-drinking, country-music kind of statistic. Think: "Friends in Sell-Low, Buy-High Places."
One article attempts to quantify the reasons, citing: "SCIENTIST DISCOVERED WHY MOST TRADERS LOSE MONEY -- 24 SURPRISING STATISTICS." See number 14:
"Investors tend to sell winning investments while holding on to their losing investments."
In other words, their timing is off key. And when it comes to seizing market opportunities, nothing is as important as timing. Our friends at Elliott Wave International said it best in the pages of their educational reference guide, Elliott Wave Principle -- Key to Market Behavior:
"To be a winner in the stock market, either as a trader or as an investor, one must know the direction of the primary trend and proceed to invest with it, not against it."
Which brings us to the next part: How do you know the direction of the primary trend?
The contribution of mainstream market wisdom abounds -- the best gauge of a market's trend is news events surrounding that market. These news events, called fundamentals, can vary from weather patterns, political events, supply/demand data, trade wars, earnings reports, and on. The way it works is:
A. Positive news supports price and fuels a rising trend
B. Negative news deflates price and ignites a falling trend
This supposedly applies to all markets, especially commodities where supply is physical and finite. Reality, however, is a horse of a different color.
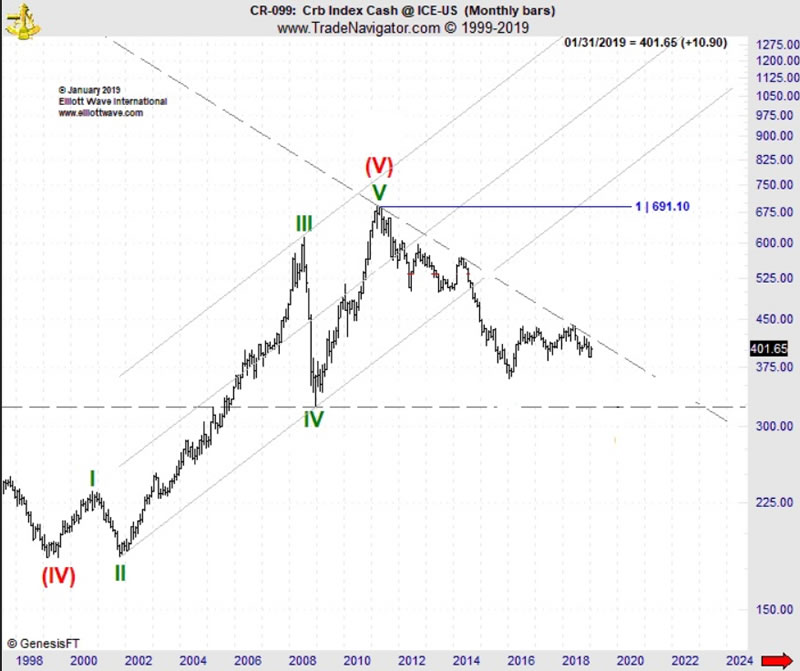
Take the broad commodity sector in 2010-2011. At the time, commodities were enjoying a strong rebound, with the CRB Index orbiting a three-year high. Mainstream financial experts used a barrage of bullish news events -- from soaring energy costs, growing economic uncertainty, mounting inflation fears, and an accommodative Fed -- to identify a healthy, rising trend. Here, these 2010-2011 news items provide a screenshot of the bullish consensus:
- "Commodities on Fire! Investors want assets to protect themselves against rising inflation and possible shortages in the future, so the surge in commodities looks set to continue." (April 11, 2011 Financial Post)
- "The world is in the middle of a commodity boom cycle" (June 8, 2011 Wall Street Journal)
- "Traders are shrugging-off the frightening nightmare of 2008, but instead, are riding high on the magic carpet buoyed by 'Quantitative Easing.'" (January 6, 2011 Bullionvault)
Wrote one January 2011 CNN Money:
"Commodities of all types have been running like scalded monkeys. Hard and soft commodities, and shiny and not so shiny metals are on a tear...it appears that we are in the midst of a commodity super cycle."
The fundamental markers were positive. The CRB Index's trend was up. The road ahead was higher.
Except, it wasn't. The exact opposite scenario unfolded. Between 2011 and 2016, the CRB Index plummeted more than 50% in an unrelenting bear market that has seen prices slog sideways since. It goes without saying, fundamental analysis failed at its most important job -- enabling traders to know the direction of the primary trend and "proceed to invest with it, not against it."
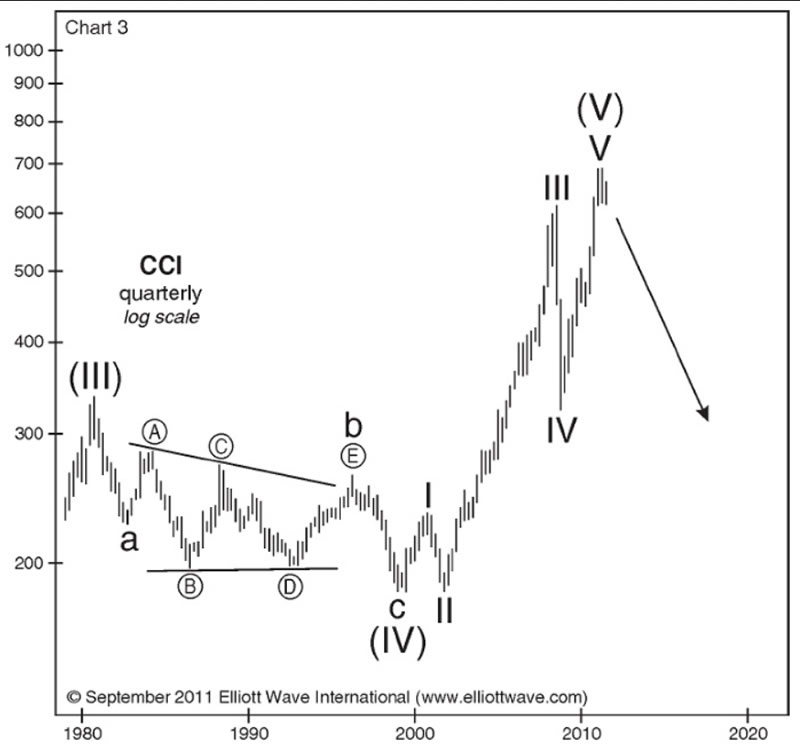
Alternatively, there was Elliott Wave International's chief commodity analyst and co-author of Elliott Wave Principle -- Key to Market Behavior Jeffrey Kennedy. In his September 2011 Monthly Commodity Junctures, Jeffrey identified a textbook, five-wave move coming into a top on the price chart of the Continuous Commodity Index (CCI), referred to as the "old CRB."
Chapter 2 of Elliott Wave Principle -- Key to Market Behavior (EWP) shows the basis for Jeffrey's bearish forecast -- five-wave moves up are followed by three-wave corrections -- AND his ability to identify a likely downside target for that decline: From EWP:
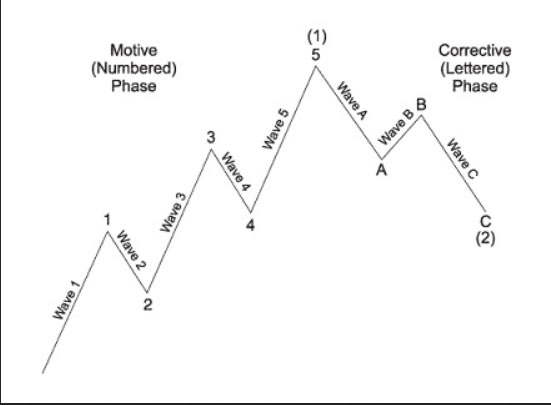
"No market approach other than the Wave Principle gives a satisfactory answer to the question, 'How far down can a bear market be expected to go?' The primary guideline is that corrections, especially when they themselves are fourth waves, tend to register their maximum retracement within the span of travel of the previous fourth wave of one lesser degree, most commonly near the level of its terminus."
Armed with this guideline, Jeffrey's warned the next move for commodities would be a historic trend change that would slash prices in half. His September 2011 Monthly Commodity Junctures wrote:
A BEAR MARKET IN COMMODITIES: THE TRAIN IS COMING
The monthly price chart of the CCI clearly displays another five-wave advance (chart 2). This impulse wave, which began in 1999, ended this year.
This argues that a decline in the CCI should actually target the December 2008 low of 322.53, the terminus of the previous fourth wave.
From there, prices embarked on a 50%-plus crash to 351, near the 2008 low of 322.53 area Jeffrey identified five years earlier!
Accurately identifying a market's trend is pivotal to success. Period. The odds of doing so require the right tools. Right now, our friends at Elliott Wave International have added the ultimate resource guide Elliott Wave Principle -- Key to Market Behavior to their FREE, online Club EWI library. This best-selling "bible" of all things Elliott is a mainstay for market newbies and veterans alike.
In the end, failure is not a result of "bad timing;" but rather, applying bad tools to perform market-timing. Elliott waves give you an alternative.
Who is Elliott Wave International? EWI is the world's largest independent technical analysis firm. Founded by Robert Prechter in 1979, EWI helps investors and traders to catch market opportunities and avoid potential pitfalls before others even see them coming. Their unique perspective and high-quality analysis have been their calling card for nearly 40 years, featured in financial news outlets such as Fox Business, CNBC, Reuters, MarketWatch and Bloomberg.
© 2005-2022 http://www.MarketOracle.co.uk - The Market Oracle is a FREE Daily Financial Markets Analysis & Forecasting online publication.