


Gold GLD Update… Bear Watch
Commodities / Gold & Silver 2019 Nov 10, 2019 - 06:16 PM GMT

A line chart can give you a different perspective vs a bar chart which is why I like to use them both to help uncover a potential pattern. Line charts can often times give you a quicker heads when a stock is breaking out.
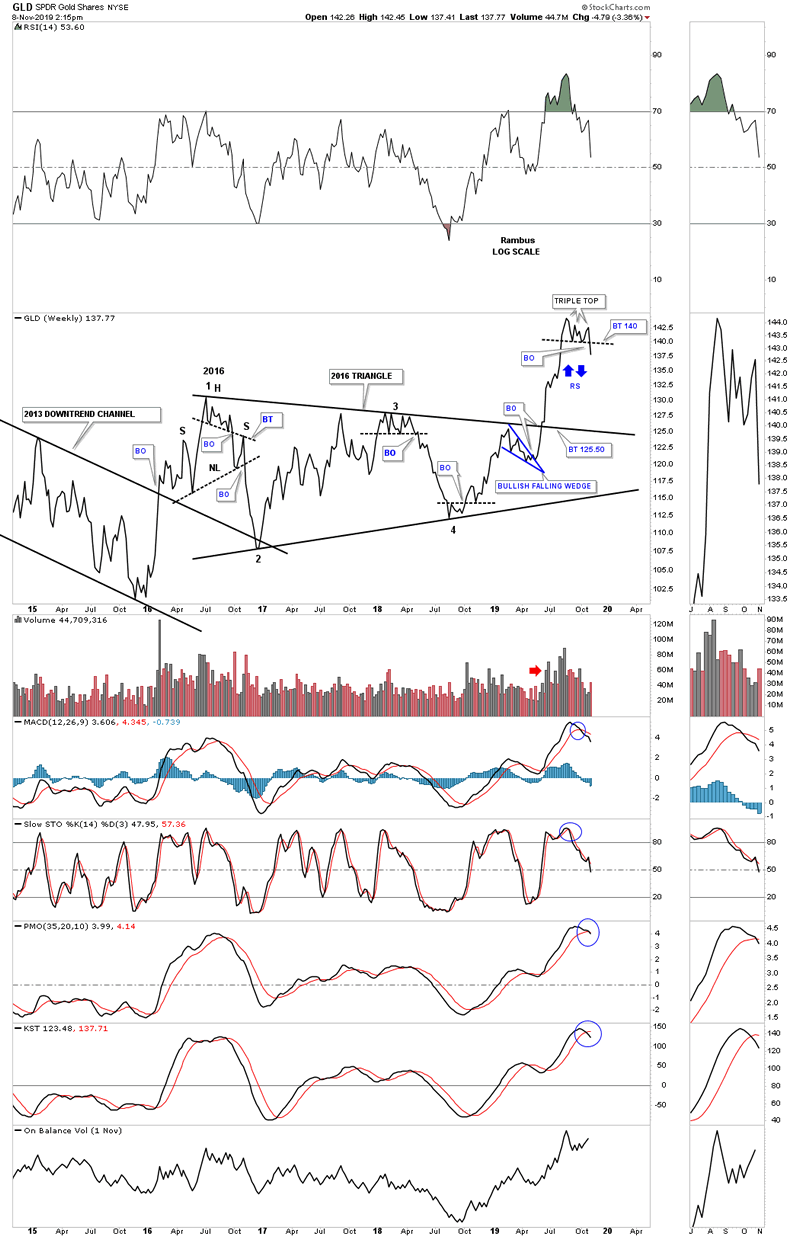
Below is a weekly line chart for GLD which shows you why I’m so concerned about the PM complex right now. As you can see this weekly line chart shows a triple top with the breakout in progress. My biggest concern is that we could see some reverse symmetry to the downside as shown by the blue arrows. Many times how a stock goes up is how it may come down over that same area especially when the move was strong.
Note the tops at the 2016 high at reversal point #1 and the 2018 top at reversal point #3 in the 2016 triangle. After the initial breakout from the top in 2016 the price action backtested the top trendline which produced the right shoulder of a bigger H&S top and then came the strong impulse move down. Some of you may remember the 2018 top when GLD was trying to breakout to a new high but could muster up enough energy to do so. I said if the bulls were in charge that it was time for them to step up to the plate but after 4 hits of the top rail the bears finally won the battle with another strong impulse move to the downside.
At a bare minimum we currently have a reversal pattern in place, triple top, that is reversing the last impulse move up. There is not a lot of support to slow down a move lower which is why we could possibly see a strong move to the downside, reverse symmetry.
All the best…Rambus
By Rambus Chartology
FREE TRIAL - http://rambus1.com/?page_id=10
© 2019 Copyright Rambus- All Rights Reserved
Disclaimer: The above is a matter of opinion provided for general information purposes only and is not intended as investment advice. Information and analysis above are derived from sources and utilising methods believed to be reliable, but we cannot accept responsibility for any losses you may incur as a result of this analysis. Individuals should consult with their personal financial advisors.
© 2005-2022 http://www.MarketOracle.co.uk - The Market Oracle is a FREE Daily Financial Markets Analysis & Forecasting online publication.