


This Time is Different for Gold - Today vs. 2012
Commodities / Gold & Silver 2019 Nov 24, 2019 - 10:22 PM GMTBy: Gary_Tanashian

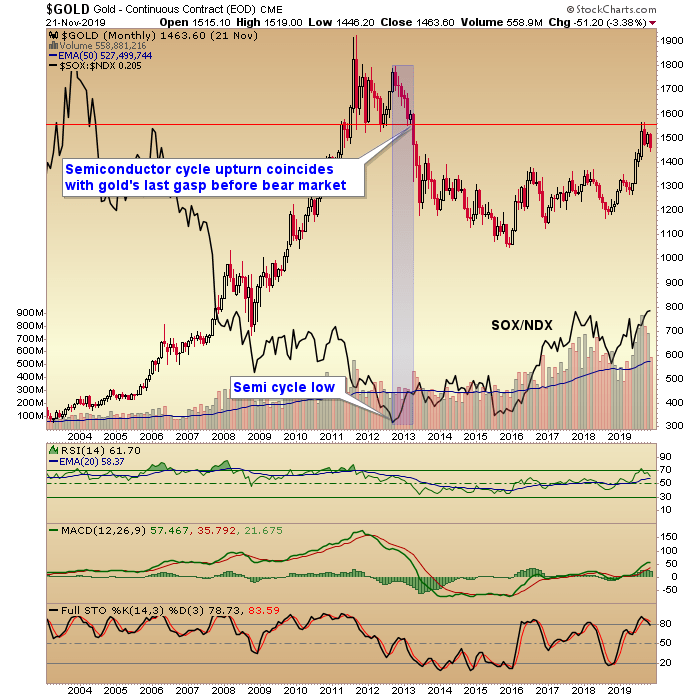
 Gold bugs will remember 2012 as the last year of hope that gold was still in its bull cycle as it managed to hold key support around 1550 into year end. It should not be lost on us that here into year-end 2019 gold’s new bull cycle has risen to, and logically halted at, the very same former support that is now important resistance to a new bull market.
We anticipated this resistance in the summer, and although the up-turning Semi cycle of 2013 was logical to gold’s demise 7 years ago, that is no longer the case as Semiconductor leadership takes a new leg up in 2019. Why? Well, let’s explore just a few of the differences between then and now.
Difference #1: The Yield Curve
The post-crisis era into 2012 was “inflation all the way baby!” as so well stated by my friend, the late Jonathan Auerbach back in Q4 2008. It was monetary fire hoses all day everyday and policy makers didn’t care who knew it. There was a major systemic meltdown of the previous inflation in play and of course our heroes at the Fed fought that realized risk with more of what created it in the first place, balls out inflationary policy.
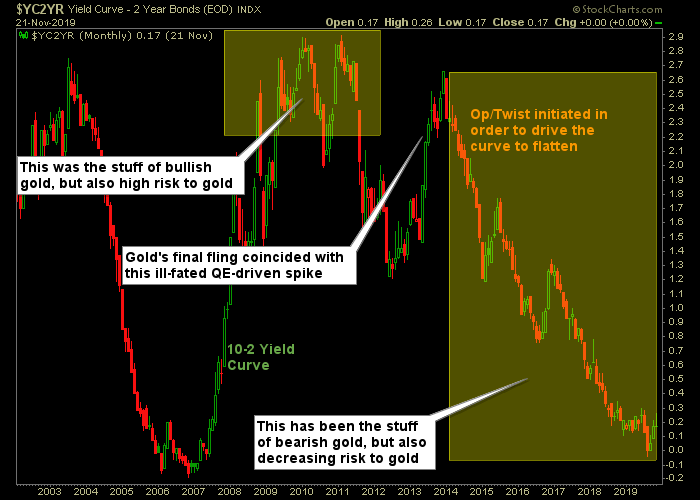
The crowning achievement – and gold killer – of post-crisis policy was 2011’s Operation Twist and its stated mission of controlling the yield curve, as Twist’s agenda to buy long-term Treasury bonds and sell short-term Treasury bonds was the very essence of a flattener. That cannot be disputed. Bernanke kicked off the great flattening and gold was done for years to come.
That’s what was happening in the post-2011 environment when a great inflator named Ben Bernanke, defeated inflation (work with me here, it’s Wonderland after all) and drove its signaling toward global deflation and US Goldilocks (as the new Semiconductor cycle was birthed). What is happening today as a new Semi cycle tries to get off the ground is completely opposite, with no inflation signaling by the yield curve and US and global central banks seemingly free to inflate because… no inflation!
A steepening yield curve is an important fundamental consideration for a bullish gold view. That can be due to a curve steepening under pains of economic contraction and market liquidity crises (ref. 2008) as players fly into shorter-term, lower risk instruments (safer cash equivalents) and short-term bonds rise better than long-term bonds; or a steepening can occur under pains of inflation fears as long-term yields rise faster than short-term yields as players run from instruments (i.e. long-term bonds) that would continue to be degraded by future inflation.
While the flattening yield curve has been gold-bearish for years, one look at the chart above tells you where’s the risk (believing the flattening trend will continue indefinitely) and where’s the reward (an eventual steepening). Hence, gold is bullish by this marker on a risk vs. reward basis and in 2011-2013 the opposite was the case.
Difference #2: The Trends
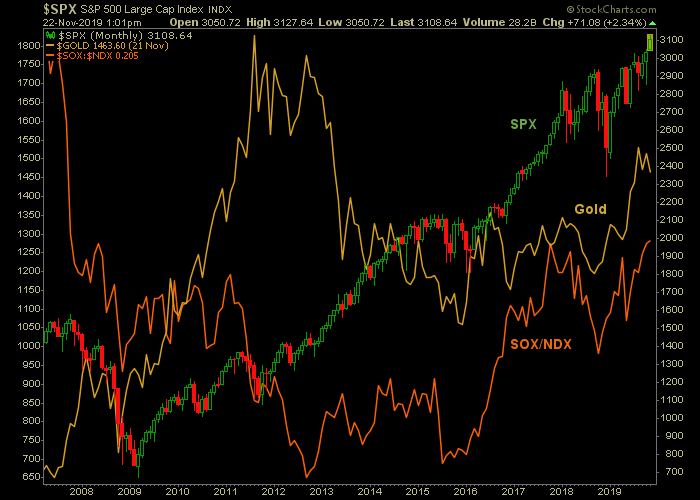
On this cycle, it’s as simple as viewing the gold price that turned up in 2019 along with the SOX/NDX ratio and along with a still-bullish S&P 500. What does that mean, since bullish stocks were anathema to a positive gold price for most of the bear market?
Well, let’s again consider the yield curve and the idea of inflationary vs. deflationary. In 2011 the Fed and its heroic leader were cooking up a way to make it look like they had not just carpet bombed the macro with inflation over the preceding 3 years. The rise in gold first, and then silver and commodities threatened to blow the lid off their scheme. So the curve was rigged downward, inflation signals were simply eliminated (voila!) and they all lived happily ever after.
Well no, some of them lived happily ever after. That would be stock bulls and eventually even economy bulls as signaled by the post-2012 Semi cycle signal, because the inflation had to go somewhere and on this cycle it went to the right places this time. But it was still inflation even if the traditional receivers of inflationary bids Gold>Silver>Commodities were played out.
So who’s more vulnerable now on a risk vs. reward basis? Well, it is no longer gold, silver and commodities. The more vulnerable items are those that were less vulnerable in 2012. That said, inflation, if a steepening curve proves to be inflationary, can lift a lot of different boats for part of the cycle at least.
Difference #3: US Dollar
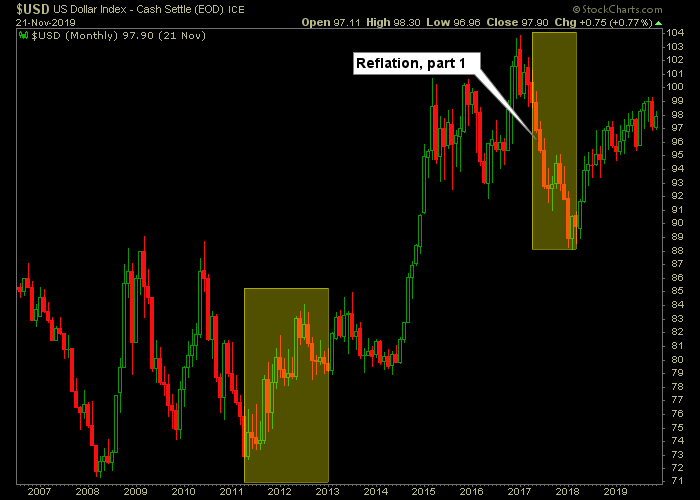
The 2011 low in the USD corresponded with silver and commodities blowing off in a blaze of inflationary glory. Gold blew out to a less dramatic degree later that year. This was after Uncle Buck made its higher low and began the current cyclical bull.
However, putting aside the fact that USD is in a funky looking pattern (i.e. not noticeably bullish looking) I’ve marked the chart up to show what the market thought upon Trump’s election. It rightly thought that “reflation” was the theme as Trump would seek to weaken the currency in service to better trade balances. He found currency manipulation to be a tall task and has shifted to an out and out trade war and associated tariffs, leaving the currency weakening to the Fed. Thus far the Fed is playing it coy, but in other actions like tacit QE it shows a potentially weak hand in waiting.
The US dollar is 37% higher today than it was when gold topped out. If the macro goes a certain way and it is anti-USD reflationary, gold can go along with said global macro even if that macro is positive. While there is too much conventional association with gold to inflation (it’s not a reliable inflation hedge on any given interim time frame) it is often pro-inflation. The yield curve for one and and USD for two, are set up for gold to benefit in any global macro inflation/reflation trade that may come about in 2020.
And if the macro souffle’ falls in 2020? I don’t want to sound like a gold perma-bull pom pom waver but gold would benefit from a risk ‘off’ lurch for liquidity just as it did in the immediate aftermath of the acute phase of the 2008 crisis. That is the reason the damn thing went through a 7+ year bear market in the first place. That would be the case where the Gold/Silver ratio and USD ride together as the 2 Horsemen of liquidity destruction.
Bottom Line
We (NFTRH) prepared over the summer for the precious metals correction that is in force right now. As a macro market guy I will never knowingly B/S myself or readers about why gold should be bullish when the fundamental indicators show that not to be true. So I am sensitive to the 2013 cyclical upturn in the Semi sector that led the economy even as we have tracked a new upturn over the last year.
The question is “why should it be different this time?” respect to a gold-bullish view. The post above scratches the surface, but it’s a completely different world of today vs. 2012. The next big market event is not likely to look like the more recent big events.
Subscribe to NFTRH Premium (monthly at USD $33.50 or a 14% discounted yearly at USD $345.00) for an in-depth weekly market report, interim market updates and NFTRH+ chart and trade setup ideas, all archived/posted at the site and delivered to your inbox.
You can also keep up to date with plenty of actionable public content at NFTRH.com by using the email form on the right sidebar and get even more by joining our free eLetter. Or follow via Twitter ;@BiiwiiNFTRH, StockTwits or RSS. Also check out the quality market writers at Biiwii.com.
By Gary Tanashian
© 2019 Copyright Gary Tanashian - All Rights Reserved
Disclaimer: The above is a matter of opinion provided for general information purposes only and is not intended as investment advice. Information and analysis above are derived from sources and utilising methods believed to be reliable, but we cannot accept responsibility for any losses you may incur as a result of this analysis. Individuals should consult with their personal financial advisors.
Gary Tanashian Archive |
© 2005-2022 http://www.MarketOracle.co.uk - The Market Oracle is a FREE Daily Financial Markets Analysis & Forecasting online publication.