


Stock Market Liquidity & Volume Diminish – What Next?
Stock-Markets / Stock Markets 2019 Dec 02, 2019 - 07:25 PM GMTBy: Chris_Vermeulen

As the Thanksgiving holiday passes, traders should begin to understand that liquidity and volume in the US and global markets typically begin to diminish over the next 30 to 45+ days. Typically, between mid-November and early January, trading volumes weaken dramatically as institutional and retail investors move away from the markets in preparation for year-end celebrations and tax planning.
Historically, the month of November is vastly more positive than negative in terms of overall price action. Over the past 21 years in the NQ, a total of 15 months have resulted in an average of +122.75 pts whereas only 6 months have resulted in an average of -194.83 pts. This suggests the downside price moves, when they happen, are nearly 40% larger than the average upside price move for November. So far for 2019, the NQ is +320.25 pts for November 2019.
November Historical Data Results:
===================================================
– Largest Monthly POS : 332.25 NEG -768
– Total Monthly NEG : -1169 across 6 bars – Avg = -194.83
– Total Monthly POS : 1841.25 across 15 bars – Avg = 122.75
——————————————–
– Total Monthly Sum : 672.25 across 21 bars
Analysis for the month = 11
For December, the historical data is split evenly – 10 months show positive results and 10 months show negative results. The positive average is +129.15 and the negative average is -117.95. This data suggests that December is historically slightly more positive than negative – but overall, December is a very FLAT month for trading in the NQ.
===================================================
– Largest Monthly POS : 782 NEG -616.25
– Total Monthly NEG : -1179.5 across 10 bars – Avg = -117.95
– Total Monthly POS : 1291.5 across 10 bars – Avg = 129.15
——————————————–
– Total Monthly Sum : 112 across 20 bars
Analysis for the month = 12
===================================================
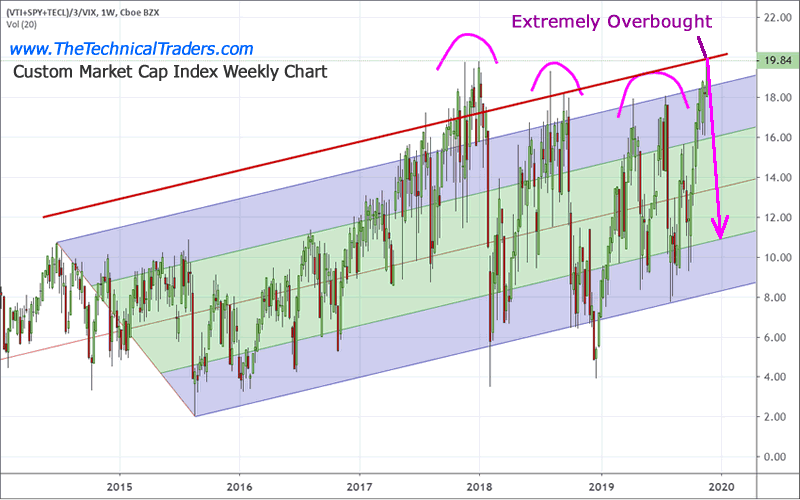
It is very likely that the recent rally in the US stock markets has reached very near to a price peak headed into the end of 2019. Our custom Market Cap Index is suggesting the US/Global markets could be setting up for a broader price rotation over the next few weeks and months.
When the Custom Market Cap Index reaches these Extreme Overbought levels, it is very common for the markets to enter a retracement period that will likely result in a downside move in the Custom Market Cap Index towards the middle “Green” area. The only time we’ve seen any type of extended upside price pressure was in late-2017 when the globe rallied after President Trump was elected expecting a boost in global economic activity. Still, if you pay attention to the rotation near this period of time, you’ll see that violent price rotation did take place just before the peak in January 2018. Take 8 seconds and enter your email address and join my free trend signals email list.
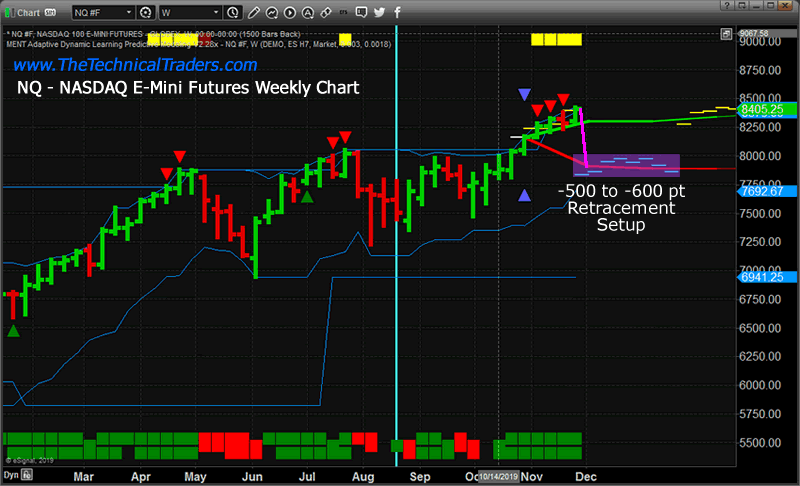
Our Adaptive Dynamic Learning (ADL) predictive modeling system is also suggesting a downside price rotation for the NQ which further validates our expectations that the US and Global markets have reached levels that are extremely overbought. We authored a research post titled “Welcome To The Zombie-Land Of Investing” in early November – prior to this melt-up price rally. You can read that article here: https://www.thetechnicaltraders.com/welcome-to-the-zombie-land-of-investing-part-ii/
We continue to believe the collapsing foreign markets have driven capital and investment into the US stock market and further investment into more mature economic markets as investors flee risks and pricing pressures throughout the world. Current news continues to support this premise and we believe the global pressures related to economic output and expectations will begin to weigh more heavily in the US stock market – specifically in regards to profitability, debt levels, and future expectations.
Additionally, we believe the continued collapse in Crude Oil is a very strong sign the global economy is contracting faster than anyone really expected and that continued price weakness may result in a price reversion event in the near future. We authored a number of research articles about these facets of the global markets over the past few months…
Nov 15, 2019: WHEN OIL COLLAPSES BELOW $40 WHAT HAPPENS? PART III
Nov 3, 2019: WARNING: CREDIT DELINQUENCIES TO SKYROCKET IN Q4
Oct 20, 2019: BLACK MONDAY 1987 VS 2019 – PART II
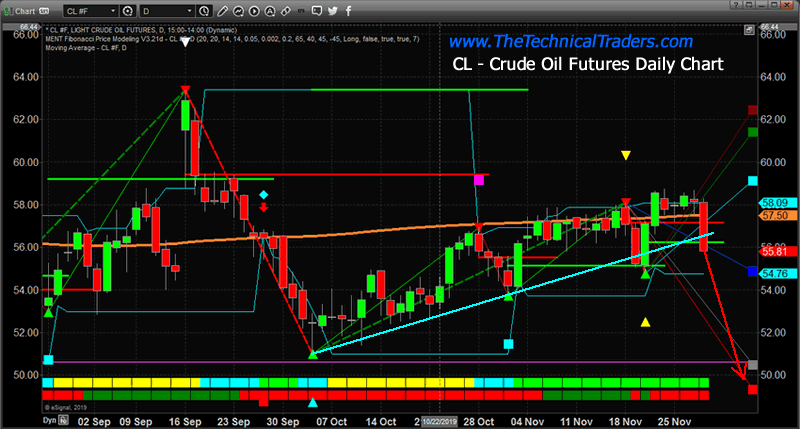
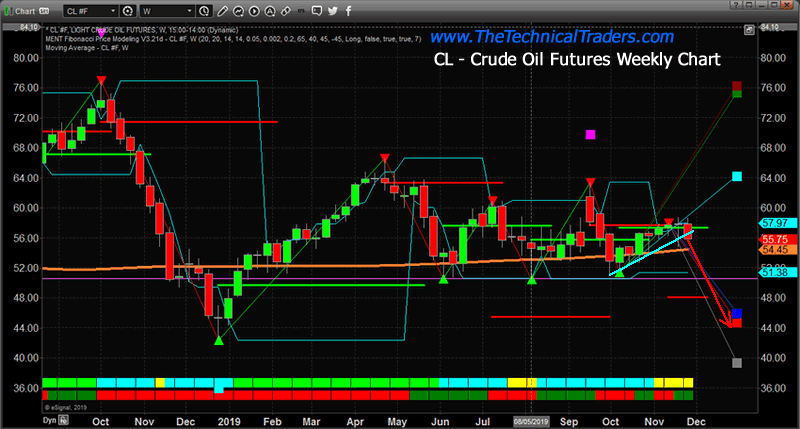
Our ADL predictive modeling system suggested Crude Oil would collapse from levels near $57~58 to levels just below $49 in November 2019. This prediction was made in early July 2019. It is amazing how our ADL predictive modeling system can see into the future like this. Now, all we are waiting for is the further price contraction in Crude Oil to our expected price levels for November. Once that sets up, then we should see a brief pause in price rotation in December 2019, then further selling in early 2020 reaching near a bottom in February or March 2020.
Demand for Crude Oil is waning dramatically near the end of 2019. There appears to be some level of chaos throughout much of the world and we believe additional uncertainty related to the US Presidential Elections, Super-Cycle events/expectations, and a mature global market contraction will continue to put demand/pricing pressures on many commodities/global markets.
The one thing we’ve been warning about for almost 14+ months is the incredible opportunity setting up in Precious Metals.
Sept 24, 2019: IS SILVER ABOUT TO BECOME THE SUPER-HERO OF PRECIOUS METALS?
Now is the time to prepare for some of these big rotation expectations over the next 15+ months. The end of 2019 and almost all of 2020 are certain to be filled with extreme volatility, liquidity issues and more. If you are a skilled trader and want better insight into what is happening and how to profit from these fantastic setups, take a minute to see how we can provide you with winning trades to stay months ahead of these moves and ride the wave of success!
Chris Vermeulen
www.TheTechnicalTraders.com
Chris Vermeulen has been involved in the markets since 1997 and is the founder of Technical Traders Ltd. He is an internationally recognized technical analyst, trader, and is the author of the book: 7 Steps to Win With Logic
Through years of research, trading and helping individual traders around the world. He learned that many traders have great trading ideas, but they lack one thing, they struggle to execute trades in a systematic way for consistent results. Chris helps educate traders with a three-hour video course that can change your trading results for the better.
His mission is to help his clients boost their trading performance while reducing market exposure and portfolio volatility.
He is a regular speaker on HoweStreet.com, and the FinancialSurvivorNetwork radio shows. Chris was also featured on the cover of AmalgaTrader Magazine, and contributes articles to several leading financial hubs like MarketOracle.co.uk
Disclaimer: Nothing in this report should be construed as a solicitation to buy or sell any securities mentioned. Technical Traders Ltd., its owners and the author of this report are not registered broker-dealers or financial advisors. Before investing in any securities, you should consult with your financial advisor and a registered broker-dealer. Never make an investment based solely on what you read in an online or printed report, including this report, especially if the investment involves a small, thinly-traded company that isn’t well known. Technical Traders Ltd. and the author of this report has been paid by Cardiff Energy Corp. In addition, the author owns shares of Cardiff Energy Corp. and would also benefit from volume and price appreciation of its stock. The information provided here within should not be construed as a financial analysis but rather as an advertisement. The author’s views and opinions regarding the companies featured in reports are his own views and are based on information that he has researched independently and has received, which the author assumes to be reliable. Technical Traders Ltd. and the author of this report do not guarantee the accuracy, completeness, or usefulness of any content of this report, nor its fitness for any particular purpose. Lastly, the author does not guarantee that any of the companies mentioned in the reports will perform as expected, and any comparisons made to other companies may not be valid or come into effect.
Chris Vermeulen Archive |
© 2005-2022 http://www.MarketOracle.co.uk - The Market Oracle is a FREE Daily Financial Markets Analysis & Forecasting online publication.