


Gold Will Not Surpass Its 1980 Peak
Commodities / Gold & Silver 2019 Dec 05, 2019 - 05:33 PM GMTBy: Kelsey_Williams

When gold’s price reached $850 per ounce in January 1980, it seemed as if nothing would stop the runaway train that was headed straight for $1000 per ounce. But it was stopped, and began sliding downhill quickly.
By June 1982, two and one-half years later, gold’s price had declined by sixty-five percent. At close to $300 per ounce, the price of gold seemed farther away from the $1000 mark than ever before.
At $300 per ounce, the eventual low for gold of $250 was a short distance away. But that downside price did not come until seventeen years later, in late 1999. As far as $1000 gold is concerned, that did not occur until September 2009, almost thirty years after gold peaked at $850 in January 1980.
After that gold’s price continued higher to almost $1900 in August 2011. Since then, gold’s price has declined to $1050 in December 2015 and then retraced some of that decline back up to over $1500 per ounce. Currently the price of gold is at $1460 per ounce.
Below is a chart showing a one-hundred year history of the gold price including the past forty years (1980-2019) which are summarized above…
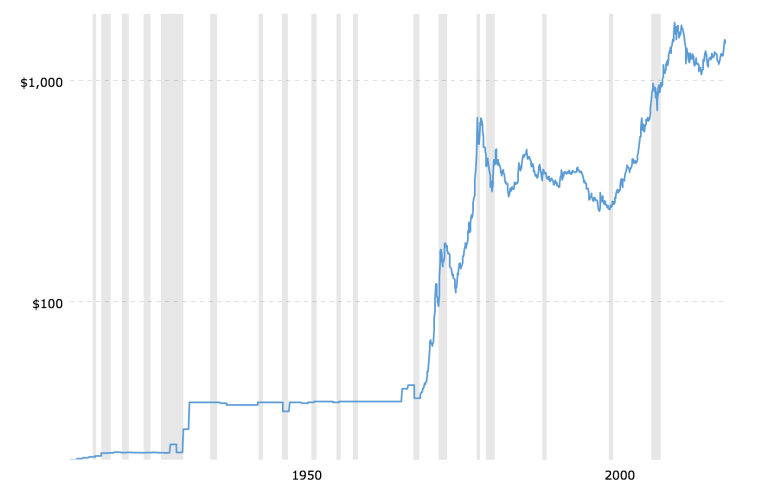
Looking at the chart, it would appear that gold’s price is in a prolonged uptrend that continues to provide positive results for long-term holders of gold who exercise patience. In real terms, however, the chart is quite deceptive.
Here is another chart of the same history. This one is adjusted for the effects of inflation…
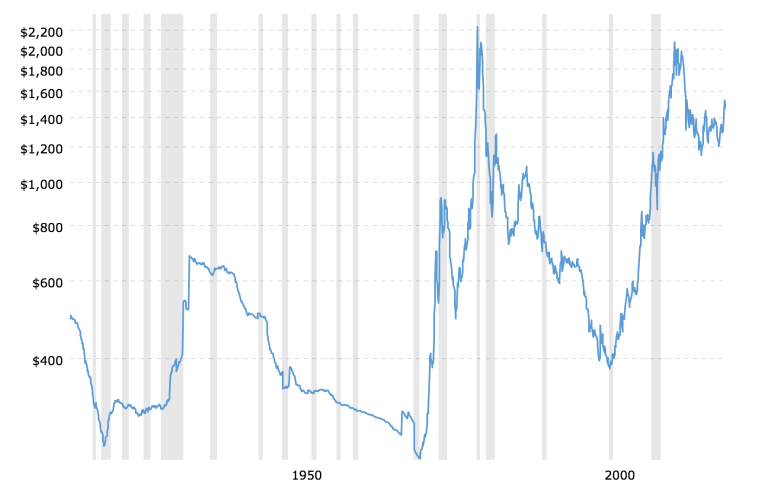
As can be seen clearly in the second chart, gold did not make a new high in 2011. Its price in inflation-adjusted dollars topped out just below its peak in 1980. Not only that, but in inflation-adjusted terms, gold’s peak intra-day price in 2011 was twenty-two percent lower than its peak intra-day price in 1980.
In other words, gold at $1900 per ounce in August 2011 represented a loss in purchasing power of more than one-fifth from its high of $850 per ounce in January 1980. Because gold has declined further since 2011, that loss in purchasing power has ballooned to almost one-half.
Very bluntly and to the point: Every dollar in gold from January 1980 to today is worth only 53 cents.
That is not because gold is a bad investment. It is because gold is not an investment. Gold’s price is an inverse reflection of what is happening to the US dollar. See the chart below…
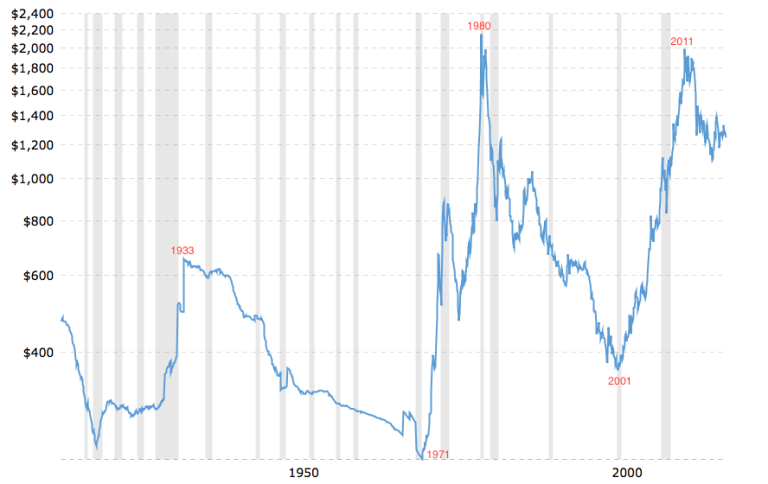
All of the major high points and low points (1933, 1971, 1980, 2001, 2011) for inflation-adjusted gold prices coincided with major changes in the relative strength and value of the US dollar. What appears to be volatility in gold is really volatility in the US dollar.
Regardless of the apparent volatility, when we look at gold over a longer period of time, a different picture emerges.
Over the past one hundred years, the US dollar has lost between ninety-eight and ninety-nine percent of its purchasing power. This correlates directly to a gold price that is currently seventy times higher than it was one hundred years ago ($20.67 x 70 = $1446).
The range in gold prices over the past several years is indicative of the broader parameters of the dollar’s decline. A ninety-eight percent decline correlates to a gold price at $1000 per ounce. Its low point in December 2015 was $1040. A ninety-nine percent decline correlates to a gold price of $2000 per ounce. Gold’s high in August 2011 was approximately $1900.
Gold’s value is in its use as money. Money’s value is in its purchasing power – what you can exchange it for. As the US dollar continues to decline in value, the price of gold, over time, will reflect that by moving higher.
Conversely, there are periods of relative strength and stability in the US dollar. During those periods, the price of gold will remain stable or move lower. Those periods are seen on the third chart above: 1) 1933-1970; 2) 1980-2000; 3) 2011-current.
Part of the problem in understanding gold is due to our inherent tendency to view changes in an item’s price as a change in its perceived value. That can be true to a certain extent when assessing the value of stocks, real estate, household goods, personal services, education, etc., or anything else for that matter – except money.
That is because money is what we use to value all of those other things. That is fine when the money is stable and a reliable store of value. (See: A Loaf Of Bread, A Gallon Of Gas, An Ounce Of Gold)
Gold is original money. It was the measure of value for everything else. The US dollar and all paper currencies are substitutes for original money; i.e., gold.
Today, some are trying to assess a value for gold based on fundamentals that are inapplicable. These so-called fundamentals include interest rates, social unrest, wars, political instability, changes in the economy, etc. None of these things have any impact on gold.
Gold’s value is constant and unchanging. Does it make sense to try to measure the value of real money – gold – using a money substitute – the US dollar?
Most analysts have it backwards. They keep analyzing gold; or trying to, anyway. And those who listen to them will continue to be confused and disappointed by results that do not meet expectations.
The object of analysis should be the US dollar.
At some point ahead, the price of gold will eventually approach and exceed its previous peak from August 2011. But in inflation-adjusted terms, it will not exceed either of its previous peaks in 1980 and 2011.
That is because the real value of gold is constant and unchanging. It is the measure of value for everything else.
For example, in today’s dollars, gold’s potential high point is slightly less than $2100 per ounce (see the second chart above). The difference between gold’s previous high of $1900 and $2100 today represents the loss in purchasing power of the US dollar that has taken place since August 2011.
Well, then, can gold’s price go higher than $2100? Yes, absolutely; but that will only happen with further deterioration in the value of the US dollar. Which means that no matter how high the price of gold goes, it will only be indicative of how weak the US dollar gets. And, however high that price is, on an inflation adjusted basis, it will not exceed its previous peaks of 1980 and 2011.
As the dollar buys less and less over time, the dollar price of gold continues to rise. But as we discussed earlier, the increasing dollar price of gold doesn’t represent profits.
The price of gold changes depending on changes in whatever money substitute is used. Right now, gold is priced, and international trades are settled in, US dollars. Changes in the dollar price of gold are indicative of changes in the US dollar.
If everyone agreed to price gold in Chinese yuan, or any other currency, or combination of currencies, nothing would change, insofar as gold’s value is concerned. (See: Gold And The USD/CNY – It’s Still About The US Dollar)
Regardless of how high, or how low, the price of gold goes, its value does not change. Changes in gold’s price are inverse reflections of changes in the US dollar.
Kelsey Williams is the author of two books: INFLATION, WHAT IT IS, WHAT IT ISN’T, AND WHO’S RESPONSIBLE FOR IT and ALL HAIL THE FED!
By Kelsey Williams
http://www.kelseywilliamsgold.com
Kelsey Williams is a retired financial professional living in Southern Utah. His website, Kelsey’s Gold Facts, contains self-authored articles written for the purpose of educating others about Gold within an historical context.
© 2019 Copyright Kelsey Williams - All Rights Reserved Disclaimer: The above is a matter of opinion provided for general information purposes only and is not intended as investment advice. Information and analysis above are derived from sources and utilising methods believed to be reliable, but we cannot accept responsibility for any losses you may incur as a result of this analysis. Individuals should consult with their personal financial advisors.
© 2005-2022 http://www.MarketOracle.co.uk - The Market Oracle is a FREE Daily Financial Markets Analysis & Forecasting online publication.