Platinum Breaks $1000 On Big Rally - What's Next Forecast
Commodities / Platinum Jan 17, 2020 - 03:35 PM GMTBy: Chris_Vermeulen
Certain precious metals, Gold, Silver, and Platinum, have shown moderate upside price trending over the past 20+ months while Rhodium and Palladium have skyrocketed higher. These more precious metals, Rhodium and Palladium, have many industrial and consumer uses. Rhodium is used in electronics and plating and Palladium is used in a variety of consumer products from Automobiles to Medical Devices.
Still, the rally in Rhodium (over 300%) and Palladium (over 70%) over the past 12 months has been more than impressive. Whey are we not seeing a similar rally in Gold, Silver, and Platinum yet?
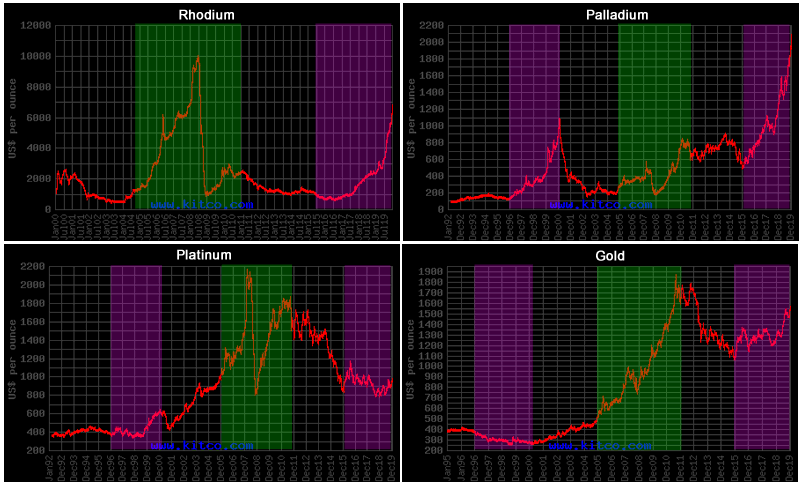
The reality is that we are seeing a similar price rally in Rhodium and Platinum as we saw in 2004~2008 – just prior to the Global Credit Crisis. Take a look at the composite chart below.
There are few interesting components of these charts that show how precious metals reacted throughout the 1997~2000 rally and the 2005~2008 rally – both of these events set up a bubble burst reversion event.
_ Rhodium rallied extensively in 2005 through 2008 – peaking at levels near $10,000 just before the credit crisis bubble burst.
_ Palladium rallied a moderate amount in 2005 through 2007, then sold off as the bubble burst. Then rallied to over $800 after fear set into the markets.
_ Platinum began a rally in early 2000 that propelled it to a peak in 2007 (just before the peak in the US stock market). Since then wild price rotation and a moderate reversion to levels near $1000 have set up a massive basing pattern.
_ Palladium, being an industrial use metal and being deployed in a variety of advanced technology, would tend to rally as demand for technology products and consumer products associated with Palladium components are in very high demand. Much like what happened in 1998~2000.
_ Rhodium’s rally is very likely related to manufacturing and institutional demand across the globe.
_ Platinum and Gold may be set up for an incredible upside price rally should Rhodium and Palladium extend their rallies even further.
_ We find it incredibly fascinating that Rhodium rallied nearly 1000% from 2004 to 2009 – just before the peak in the global stock markets and the start of the Global Credit Crisis.
_ We also find it incredibly interesting that Palladium rallied over 1000% from 1995 to 1999 – just before the DOT COM bubble burst.
_ We believe the rallies in Rhodium and Palladium are early warning signs that can’t be overlooked by skilled traders/investors.

The recent upside breakout of Platinum falls into the same category as the late 1998 Platinum rally as the valuations of the DOT COM rally began to overextend. We believe this shift into high-value risk protection began to take place as investor’s fear levels increased in the late 1990s. As we suggested recently – a shifting of the undercurrents in the markets.
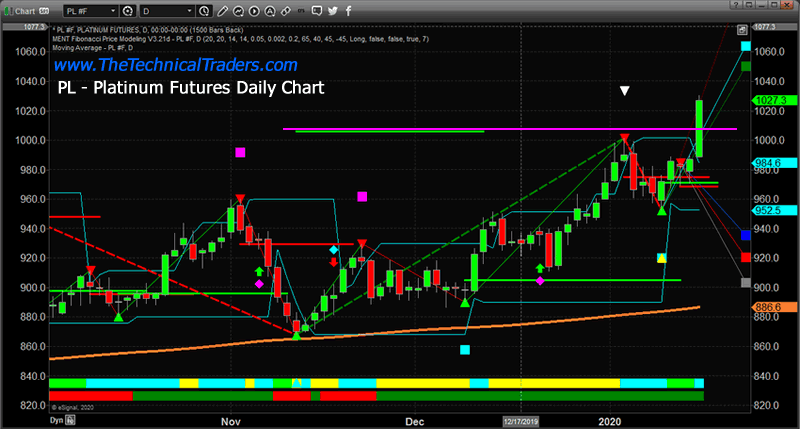
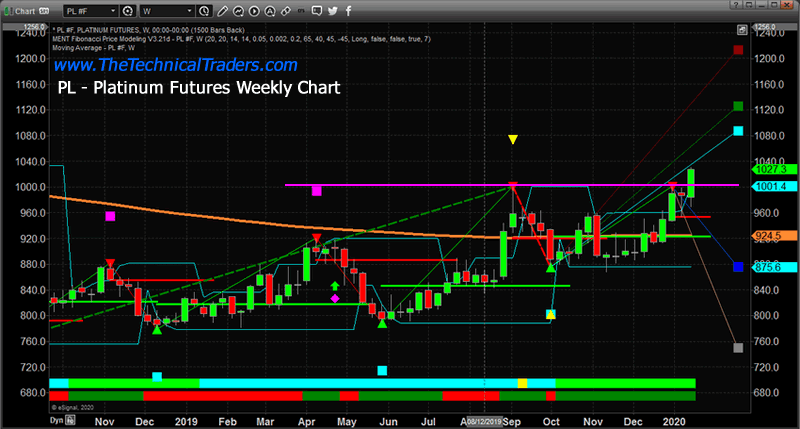
The current rally above $1000 in Platinum suggests a new upside price rally is taking place after an extensive basing pattern (2015 to now). Should Platinum rally above $1200 per ounce, a new technical bullish trend will be confirmed.

Our proprietary Fibonacci price modeling system is suggesting price targets on the Weekly chart of $1090, $1130 and $1215. Pay very close attention to this rally in Platinum as it could become the catalyst for a much bigger move in many of the major precious metals. The Platinum rally in 1997 began an upward price advance of nearly 600% over the next 10 years. A similar move today would put Platinum near $6000~$7000 – Gold would be near $3200+ should this happen.

Our belief is that the rally in Platinum will continue as valuations in the global markets push higher. Fear is creeping back into the markets as investors are expecting some type of price reversion event. We believe the current setup is very similar to a mix of the events we’ve highlighted in the composite metals chart, above. A mix of what happened in 1995~1997 and a mix of what happened in 2005~2007. Platinum and Gold are acting very similar to what happened in 1995~1997. Palladium and Rhodium are a mix of 1995~1997 and 2005~2007. Overall, the rallies in Rhodium and Palladium are strangely similar to “peak everything” bubbles.
Watch how this plays out over the next 12+ months. Gold and Silver should begin to move higher as Platinum extends the rally. Fear is starting to re-enter the markets as traders and investors extend their belief that a reversion event is setting up.
Join my Wealth Building Newsletter if you like what you read here and ride my coattails as I navigate these financial markets and build wealth while others lose nearly everything they own.
Chris Vermeulen
www.TheTechnicalTraders.com
Chris Vermeulen has been involved in the markets since 1997 and is the founder of Technical Traders Ltd. He is an internationally recognized technical analyst, trader, and is the author of the book: 7 Steps to Win With Logic
Through years of research, trading and helping individual traders around the world. He learned that many traders have great trading ideas, but they lack one thing, they struggle to execute trades in a systematic way for consistent results. Chris helps educate traders with a three-hour video course that can change your trading results for the better.
His mission is to help his clients boost their trading performance while reducing market exposure and portfolio volatility.
He is a regular speaker on HoweStreet.com, and the FinancialSurvivorNetwork radio shows. Chris was also featured on the cover of AmalgaTrader Magazine, and contributes articles to several leading financial hubs like MarketOracle.co.uk
Disclaimer: Nothing in this report should be construed as a solicitation to buy or sell any securities mentioned. Technical Traders Ltd., its owners and the author of this report are not registered broker-dealers or financial advisors. Before investing in any securities, you should consult with your financial advisor and a registered broker-dealer. Never make an investment based solely on what you read in an online or printed report, including this report, especially if the investment involves a small, thinly-traded company that isn’t well known. Technical Traders Ltd. and the author of this report has been paid by Cardiff Energy Corp. In addition, the author owns shares of Cardiff Energy Corp. and would also benefit from volume and price appreciation of its stock. The information provided here within should not be construed as a financial analysis but rather as an advertisement. The author’s views and opinions regarding the companies featured in reports are his own views and are based on information that he has researched independently and has received, which the author assumes to be reliable. Technical Traders Ltd. and the author of this report do not guarantee the accuracy, completeness, or usefulness of any content of this report, nor its fitness for any particular purpose. Lastly, the author does not guarantee that any of the companies mentioned in the reports will perform as expected, and any comparisons made to other companies may not be valid or come into effect.
Chris Vermeulen Archive |
© 2005-2022 http://www.MarketOracle.co.uk - The Market Oracle is a FREE Daily Financial Markets Analysis & Forecasting online publication.


