


Gold Long-Term CoT Perspective
Commodities / Gold & Silver 2020 Jan 30, 2020 - 12:36 PM GMTBy: Gary_Tanashian

Because it’s so important to see this correctly and not pretend we (well, I) know more than we (I) actually do I find it important to look at pictorial representations of history and think about them when I get some quiet time (ha ha ha, like not on Twitter, not reading financial/gold websites and most certainly not watching TeeVee finance and news).
So I am thinking about the Commitments of Traders alignment with respect to the gold price once again. That would be the same CoT that has doggedly hung a poor risk vs. reward sign out over the sector from a sentiment standpoint since the summer.
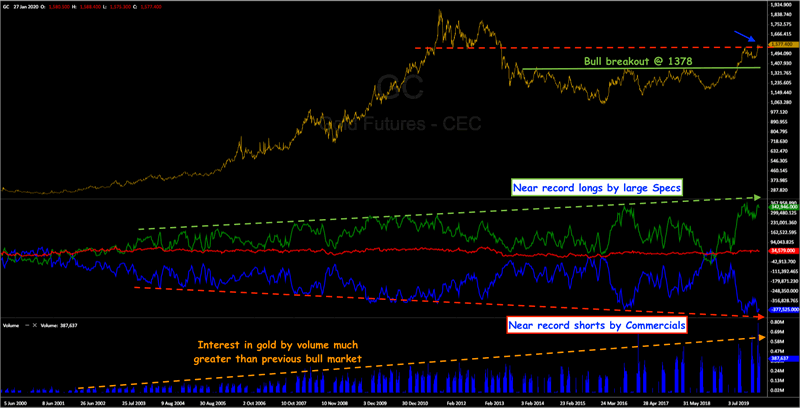
Okay, so the Specs are way more net long than they were in May. The Commercials (hedgers and nefarious goons alike) are way more net short. Below is a chart that I grabbed from this website and marked up. It’s pretty big, so click it and get the full view.
Assuming this chart’s historical data is correct I’ve marked it up to show why any undue alarm about the “record net shorts” in Commercial interests is just that, undue. That does not mean risk is not elevated by this sentiment measure; it is. But as often noted in NFTRH Premium and here at nftrh.com, the internal dynamics of the gold market are much different than the majority of the comps that RECORD NET SHORTS BY THE SMART MONEY!!! hysteria would imply.
First of all, the goons are not smart money. They are as a whole doing what they always do, hedging. There are gold mining companies and gold industry users in there as well, short the metal. The goons will be on the right side at the next turn, after having been on the supposed wrong side all through the rally. At that point some wise guys looking to harvest the eyeballs of the gullible will pronounce for all to read that the ‘smart money has fleeced the golden sheep once again’ or some such thing.
It’s as simple as this. Yes the readings of net longs and net shorts are pushed to historical extremes. But that means little more than it has meant throughout the post-2000 history each time the readings have approached the green and red arrows. I’ve long noted that the internal dynamics of the gold market are different now than at any time in history. This chart explains in a handy view of volume.
There is much more volume interest in gold now and so it follows that the net positioning of players within the market will be much greater as well, even when merely at a normal extreme, as with the 2007 and 2016 extremes, for example.
But the chart also shows something we’ve reviewed in the past with respect to the early phase of the previous bull market (“bull rules are different than bear rules”, right?). Gold spent a fair amount of time with the readings at extremes while the metal continued to rise (with all due volatility, as it’s the gold market after all). 2005 jumps off the chart as one of those times as gold accelerated higher despite CoT extremes. 2009 to the cycle’s end in 2011 is another.
The bottom line is as usual; calm the noise, see the noise makers for what they are * and keep your head screwed on straight. That means checking it (your head, not necessarily the gold price :-)) every day to make sure the brain inside it is not being swayed by sensation as opposed to reality. This applies throughout the financial markets.
* Either well marketed entities that seek to rile up the herd’s emotions (and harvest their eyeballs) as a matter of doing business or those doing so unwittingly through incomplete or lazy analysis.
Subscribe to NFTRH Premium (monthly at USD $33.50 or a 14% discounted yearly at USD $345.00) for an in-depth weekly market report, interim market updates and NFTRH+ chart and trade setup ideas, all archived/posted at the site and delivered to your inbox.
You can also keep up to date with plenty of actionable public content at NFTRH.com by using the email form on the right sidebar and get even more by joining our free eLetter. Or follow via Twitter ;@BiiwiiNFTRH, StockTwits or RSS. Also check out the quality market writers at Biiwii.com.
By Gary Tanashian
© 2020 Copyright Gary Tanashian - All Rights Reserved
Disclaimer: The above is a matter of opinion provided for general information purposes only and is not intended as investment advice. Information and analysis above are derived from sources and utilising methods believed to be reliable, but we cannot accept responsibility for any losses you may incur as a result of this analysis. Individuals should consult with their personal financial advisors.
Gary Tanashian Archive |
© 2005-2022 http://www.MarketOracle.co.uk - The Market Oracle is a FREE Daily Financial Markets Analysis & Forecasting online publication.