


Deep Analysis and charts: Risk Market ignore global pandemic fears
Stock-Markets / Financial Markets 2020 Jan 30, 2020 - 03:13 PM GMTBy: Submissions

There has been two major events in January. First there was the brief intensification of the conflict between the U.S. and Iran, which quickly ramped back down. Secondly there is the coronavirus epidemic in China, which in the space of a week has spread from Wuhan and imprinted itself globally at pandemic levels, bringing much of China to a standstill when it would usually be celebrating the Lunar New Year.
 7
7
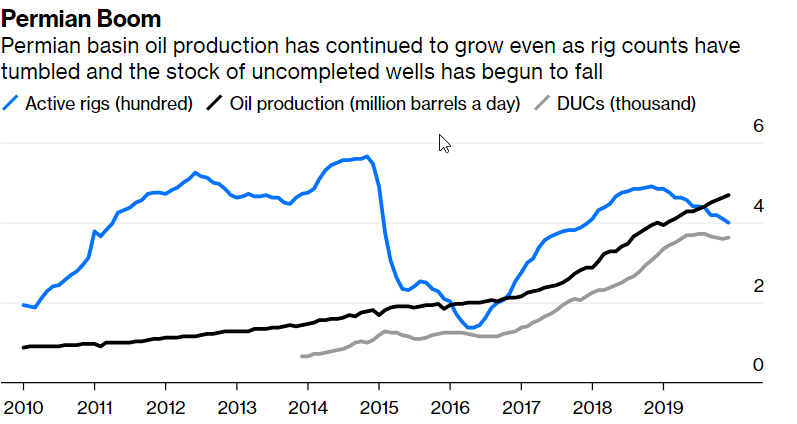
Many comparisons have been made to the SARS epidemic of early 2000. One chart below shows that the world economy was still inflating then whereas now it is flattening out as QE effects run out.
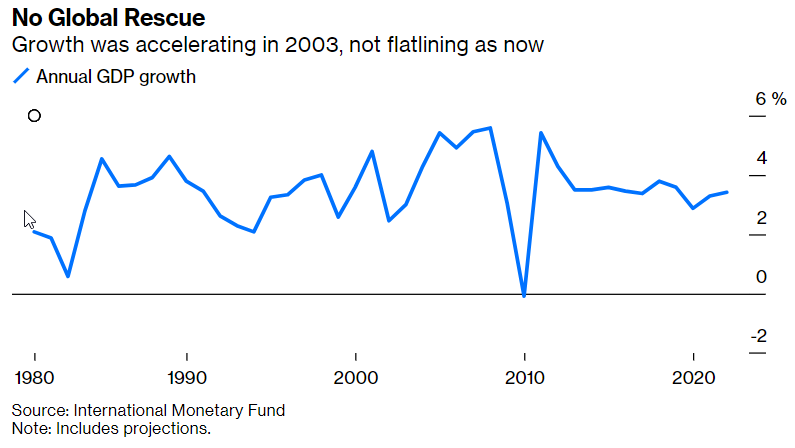
China has changed dramatically in the past 17 years. For starters, its economy is roughly eight times the size. Faced with the trade war and a cooling domestic economy, the PBOC began 2020 with a statement of intent: The central bank cut the required reserve ratio for lenders by half a percentage point, the latest in a series of reductions. PBOC has shown an increasing ability to be flexible unlike 15 years back when yuan was still pegged.
FED decision
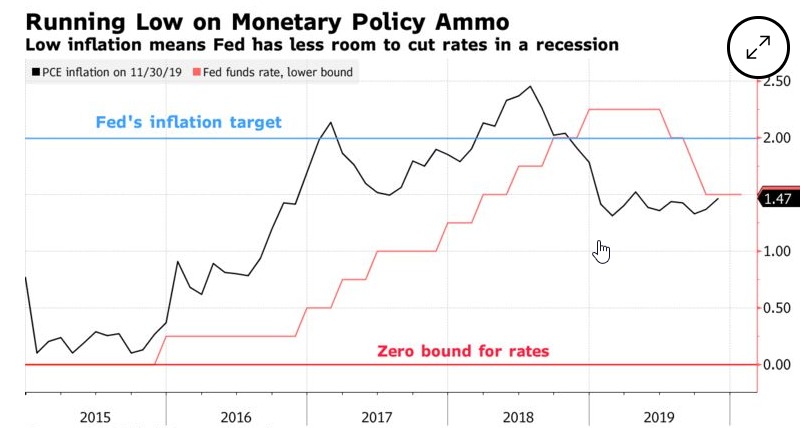
This week’s Federal Reserve monetary policy meeting will likely yield little in the way of new information. The Fed will hold its key interest rate constant and make few changes in the accompanying statement explaining the reasons for standing pat. Even so, there are a few potential risks that can’t be ignored by market participants. The number of policy makers forecasting above-target inflation in three years’ time jumped to seven in December projections. That looks like a signal they’re deliberately aiming to generate price pressures in excess of their 2% objective. Officials will not be updating their quarterly economic forecasts when they meet Tuesday and Wednesday in Washington, when they are widely expected to leave interest rates unchanged.
Forex Analysis GBP/USD currently trading at 1.3016
- GBP/USD sellers catch a breath after four consecutive days of declines.
- The UK’s favor for the Chinese tech giant negatively affects its friendship with the US.
- Brexit headlines keep calm while BOE readies for the decision.
GBP/USD trades near 1.3020 ahead of the London open on Wednesday. The cable recently weighed down by concerns of the US-UK tussle over the British allowance to the Chinese tech giant for 5G development. However, the moves are less strong ahead of the key BOE meeting on Thursday, followed by Friday’s Brexit day.
Republicans in the US have started criticizing the Tory government’s plan to allow China’s Huawei to build non-core elements of the UK’s 5G network. This is likely to weigh on the US-UK deals and could well be discussed by the US Secretary of State Mike Pompeo when he visits Britain on Wednesday.
On the Brexit side, the UK PM Johnson’s immigration efforts are gaining mixed responses with the ‘Australian-style’ immigration vision getting slapped by the independent Migration Advisory Committee (MAC).
The latest pause could also be attributed to the risk reset based on the receding pessimism concerning China’s coronavirus. The same could be witnessed in the recovery of the US 10-year treasury yields and Asian stocks.
Moving on, odds of the Bank of England’s (BOE) next move are standing on thin ice amid recently mixed data and Brexit concerns, not to forget Governor Carney’s dovish tone. Furthermore, Friday’s Brexit alarm won’t be too good to hear as the European Union (EU) and the UK will jostle over trade deals afterward and the early indicators are favoring the negative start.
Technical Analysis
A daily closing below a month-long rising support line, currently at 1.2980, can drag the quote towards a 100-day SMA level of 1.2862, until then odds of the pair’s pullback to 1.3155/60 can’t be ruled out.
GBP/USD Hourly charts and potential Trade
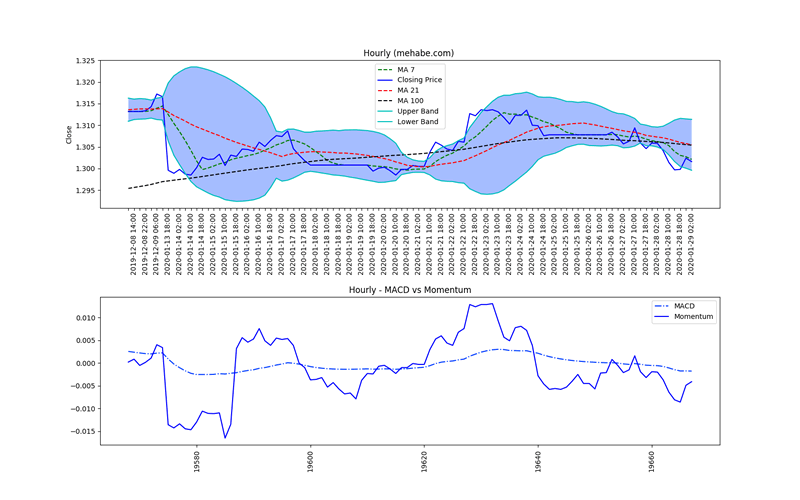
The pair opened at 1.3017 and closed at 1.3016 with a overall range of 6 pips. The high of the hourly timeframe was at 1.3019 while the low was at 1.3013. The price currently is trading at 1.3016. This is below the hourly 100 MA. The 100 MA is at 1.3054. The last hourly close was inside bollinger bands of 21 MA indicating that there may be balance of power between buyers and sellers. Unless a new move happens, clients are advised to be on the sideliness of this pair.
GBP/USD Daily charts
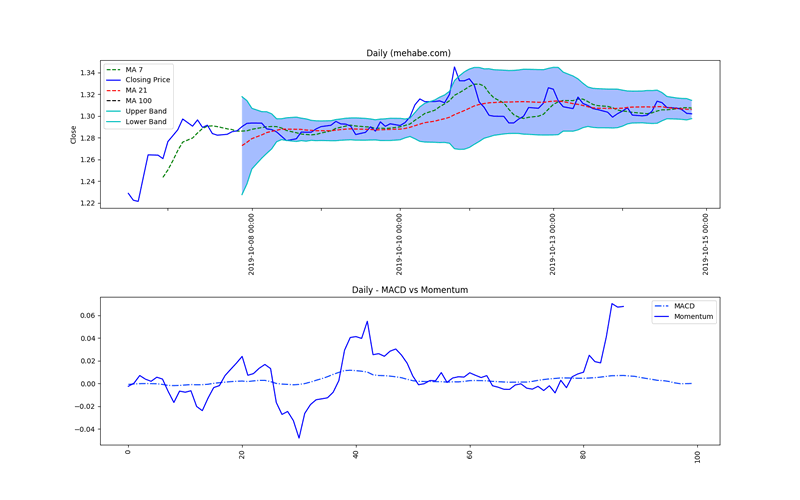
The pair opened at 1.3023 and closed at 1.302 with a overall range of 15 pips. The high of the Daily timeframe was at 1.3028 while the low was at 1.3013. The price currently is trading at 1.302. This is above the Daily 100 MA. The 100 MA is at 1.2961. The last Daily close was inside bollinger bands of 21 MA indicating that there may be balance of power between buyers and sellers. Unless a new move happens, clients are advised to be on the sideliness of this pair.
Weekly charts
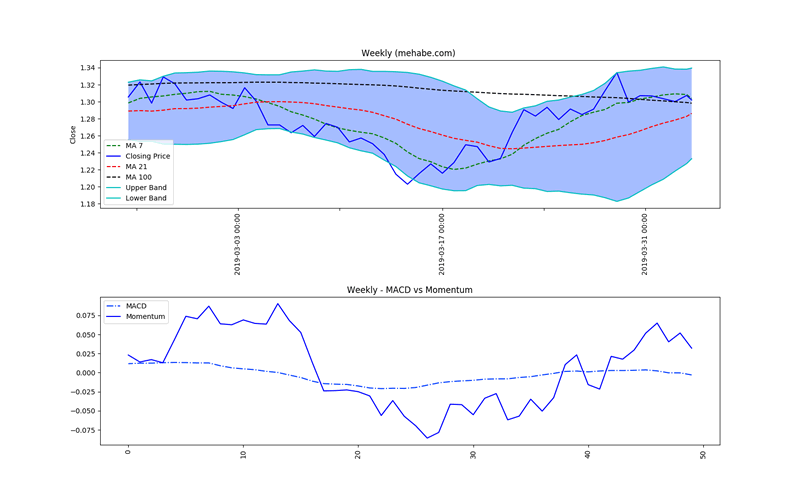
The pair opened at 1.3074 and closed at 1.302 with a overall range of 133 pips. The high of the Weekly timeframe was at 1.3106 while the low was at 1.2973. The price currently is trading at 1.302. This is above the Weekly 100 MA. The 100 MA is at 1.2982. The last Weekly close was inside bollinger bands of 21 MA indicating that there may be balance of power between buyers and sellers. Unless a new move happens, clients are advised to be on the sideliness of this pair.
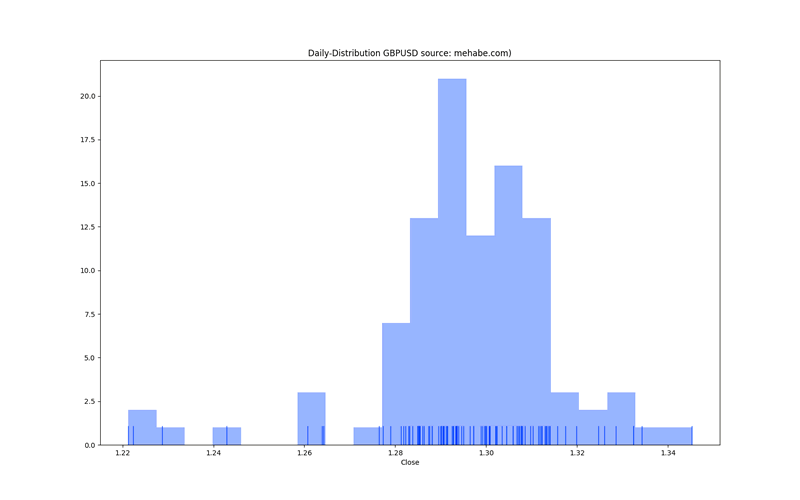
Daily Distribution charts
The following charts show the distribution of prices on daily time frame. Prices have a tendency to move towards the peak occurences which are often reflection of support and resistances.
Trade safe, keep stop losses, let winners run and cut losses is the three fold principle we follow in our managed account.
Follow us on Twitter for updates: Twitter Follow
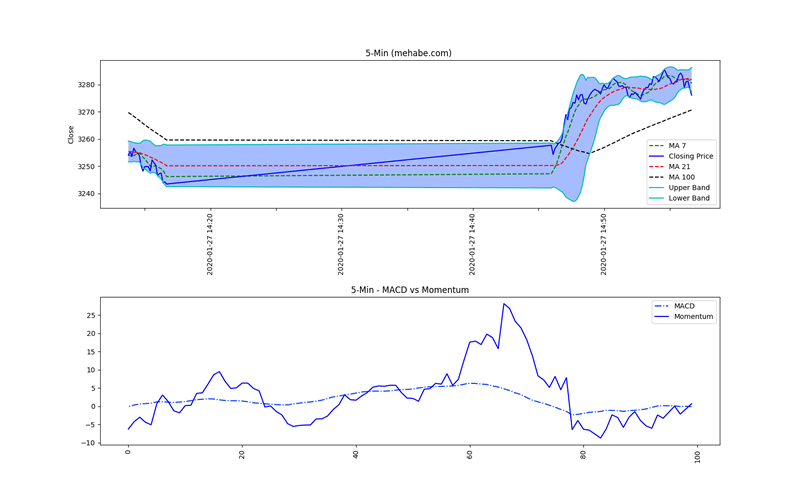
SPX Charts and Analysis SPX is currently trading at 3276.1 SPX currently trading @ 3276.0
5-Min charts
Please find Mehabe Hourly, Daily and Weekly chart analysis. Inside you will also find Renko Chart analysis.
Managed Account
The Mehabe team runs the internet finest artificial intelligence trading system based on the Echo State Network. The system is high performance and our performance for current month is noted below.
The system is offered at a nominal cost. Read more of the Mehabe Guarantee.
All fees is backended that is at end of the month. LOW DD SYSTEM.
By Mehabe
About us:
https://Mehabe.om is a Artificial Intelligence driven quantitative investing firm offering managed account, tradecopier and custom tailored investing solutions for global clients. We have a history of industry leading performance.
Website: https://mehabe.com
Email : fundsupport@mehabe.com
Copyright 2020 © Mehabe.com - All Rights Reserved
Disclaimer: The above is a matter of opinion provided for general information purposes only and is not intended as investment advice. Information and analysis above are derived from sources and utilising methods believed to be reliable, but we cannot accept responsibility for any losses you may incur as a result of this analysis. Individuals should consult with their personal financial advisors.
© 2005-2022 http://www.MarketOracle.co.uk - The Market Oracle is a FREE Daily Financial Markets Analysis & Forecasting online publication.