How Moving Averages Help You to Define Stock Market Trend
InvestorEducation / Technical Analysis Feb 29, 2020 - 05:47 PM GMTBy: EWI
One way to think of a moving average is that it’s an automated trend line.
The "moving average" is a technical indicator of market strength which has stood the test of time.
More than 30 years ago, Elliott Wave International President Robert Prechter described this indicator in his essay, "What a Trader Really Needs to be Successful." What he said then remains true today:
... a simple 10-day moving average of the daily advance-decline net, probably the first indicator a stock market technician learns, can be used as a trading tool, if objectively defined rules are created for its use.
So, what is a moving average?
Elliott Wave International's Jeffrey Kennedy, a more than 25-year veteran of technical analysis, provides an answer:
A moving average is simply the average value of data over a specified time period, and it is used to figure out whether the price of a stock or commodity is trending up or down.
One way to think of a moving average is that it's an automated trend line.
Kennedy offers examples and insights about moving averages in the instructive guide, "How You Can Find High-Probability Trading Opportunities Using Moving Averages."
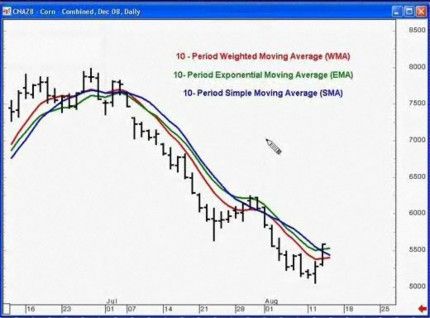
Here's an introductory chart from the guide, along with Kennedy's comments:

The chart plots three moving averages on a [past] daily chart for Corn. The red line represents a 10-period weighted moving average, the green line represents a 10-period exponential moving average, and the blue line is a 10-period simple moving average. … The exponential moving average and weighted moving average put more value on the front end, which means that while a 10-period simple moving average assigns the same weight to each period, exponential and weighted moving averages put more weight on the most recent data.
I rely mostly on the simple moving average, because simple things usually work best.
In this guide, Kennedy shows more elaborate charts as he goes into detail about the "dual moving average crossover system" and the "moving average price channel system." Moreover, he informs you how to combine the two.
Yet, also be aware that Kennedy discusses the pitfalls of relying on one "magic" moving average setting.
In the free guide, How You Can Find High-Probability Trading Opportunities Using Moving Averages, you'll also learn how to avoid being "whipsawed" by false signals.
Get instant access to this popular free trading guide now.
This article was syndicated by Elliott Wave International and was originally published under the headline How Moving Averages Help You to Define the Trend. EWI is the world's largest market forecasting firm. Its staff of full-time analysts led by Chartered Market Technician Robert Prechter provides 24-hour-a-day market analysis to institutional and private investors around the world.
© 2005-2022 http://www.MarketOracle.co.uk - The Market Oracle is a FREE Daily Financial Markets Analysis & Forecasting online publication.


