


Real Price Of Gold Soars
Commodities / Gold & Silver Oct 07, 2008 - 01:44 PM GMTBy: Mike_Shedlock

 Gold in "Real" terms is soaring. "Real" in this case means how much an ounce of gold will buy. Let's compare gold to a commodities, to silver and to the stock market, starting with a basket of commodities as measured by $CRB commodities index. Charts are as of 2008-10-06.
$CRB Monthly
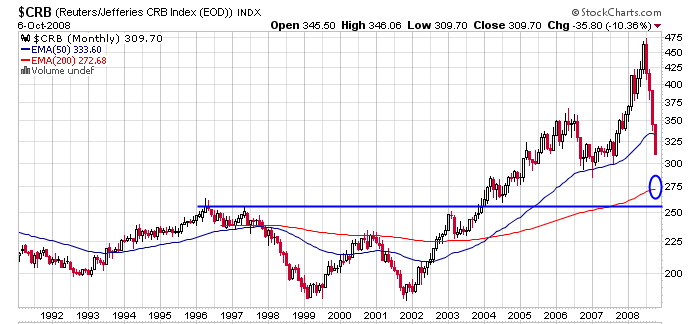
The world economy is rapidly slowing. There is a recession in the US, UK, Australia, Japan, Spain, Ireland, New Zealand, France, and there is manufacturing contraction in China. With that backdrop, one should expect the price of commodities to drop. And drop they have as shown by the above chart.
For the time being, forget about China. There is simply no way growth in China can make up for falling demand virtually everywhere else in the world. U.S. and the Western World is the dog, China remains the tail. That may change in the future, but it is important to concentrate on the present.
I expect the global slowdown to be far bigger than most expect, potentially wiping out all commodity price gains back to the beginning of 2004 if not further. A drop in the $CRB to the 200 day moving average would do just that.
Now let's see how gold is holding up vs. commodities.
Gold vs. $CRB Monthly
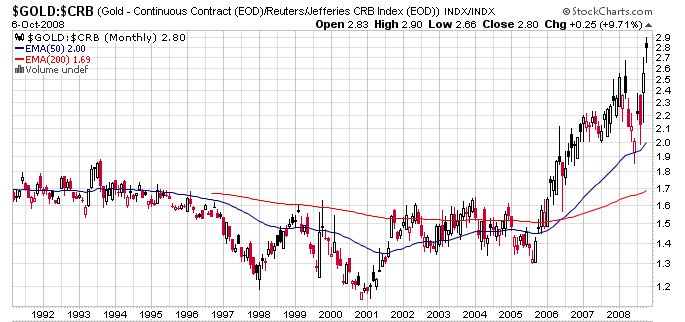
Gold buys a bigger basket of commodities now than any other point on the chart.
Silver Monthly Chart
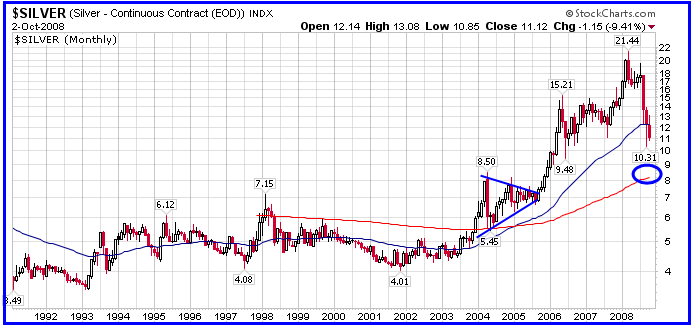
Fundamentally, silver is more of an industrial commodity than it is a currency. It is not holding up as well as gold in recent selloffs. There is a very real possibility that silver falls back to the 2004 high around $8. Those who pay attention to moving averages will note that $8 happens to be the 200 day moving average as well.
In contrast, gold has almost no industrial use worth mentioning. The demand for gold is the same as it has been throughout history, as money. With that in mind, let's compare gold to silver.
Gold vs. Silver Monthly
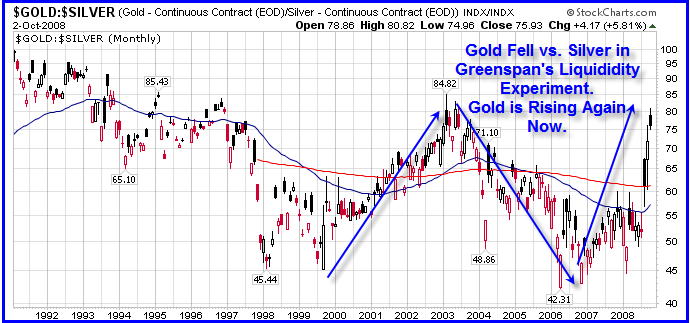
One of the ongoing debates was how well silver would hold up in deflation relative to gold. I think we now have our answer, and it does not look pretty.
S&P 500 Index Monthly
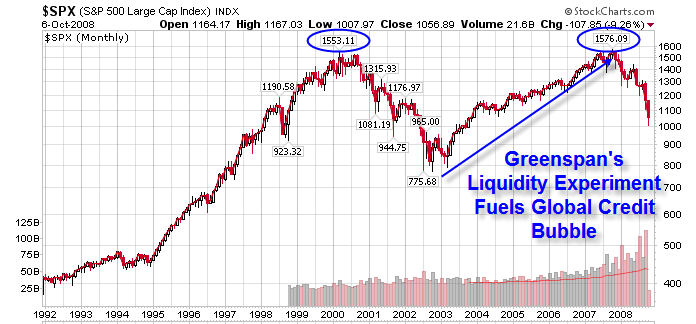
In the wake of the dot-com bubble, banks were in bad shape because they made poor lending decisions to busted companies and also to countries like Argentina. To reflate banks, Greenspan slashed rates to 1% fueling a global liquidity boom that lasted 5 years.
The housing boom ended in 2005, but the party in commercial real estate, commodities, and various carry trades continued on for two full years when the pool of greater fools finally ran out. Since August of 2007 the world has been in a massive deleveraging mode.
The S&P 500 made a marginal new top in 2007, but the reality is the secular bear market that started in 2000 is still ongoing. In real terms, (either compared to gold or the CPI) the S&P 500 came nowhere close to making a new high.
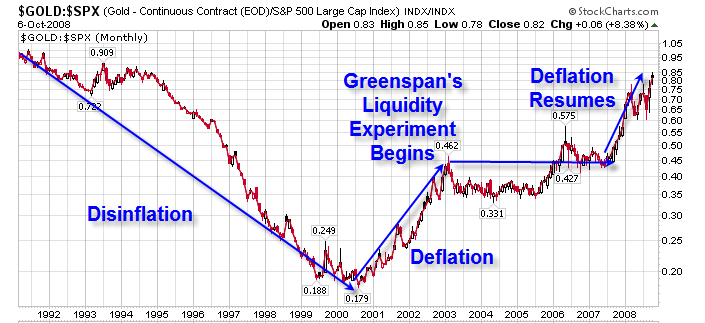
Gold vs. S&P 500 Index
Congress passed a $700 billion bailout package but it was a total and complete waste of $700 billion. Actually, it is worse than that as it further depletes the pool of real funding, slowing a possible recovery some point in the future. Yes, the Fed has started a monetary printing campaign. And yes, the SEC will suspend mark to market accounting allowing banks to pretend their book are in order.
But pretending is not reality. I can pretend all I want that Madame Merriweather's Mud Hut is worth $1 billion and I can pretend my pet rock is worth the same. The reality (sorry Madame), is that neither is worth the book value I place on them.
Suspension of the mark to market rules will accomplish nothing but further mistrust of banks and bank stocks. Everyone will know they are lying. No one will know by how much. What we do know is that Citigroup alone holds $1 trillion in off balance sheet SIVs.
Pretending those SIVs are worth $1 trillion will not make it so. Yes, $700 billion is a lot of money. But let's see just how fast it comes and let's see if all of it comes.
But unless it can offset the countless $trillions in total bank assets that are not marked to market, we are realistically still going to see credit contraction (on a marked to market basis, and that is what counts).
Attempts To Spur Lending Are Failing
Bernanke and Paulson think that the Fed buying toxic garbage will spur institutions to start lending. It won't. Banks will know they are holding garbage, and the market can smell that garbage even if the rules allow banks to pretend that garbage is a rose.
For more on the Fed's efforts to spur lending please see Pushing on a String In Academic Wonderland and Thoughts On The Commercial Paper Funding Facility .
Greenspan did not defeat deflation in 2003 as is widely believed. Instead, he fueled the biggest credit boom in history, sowing seeds of the biggest deflationary bust since the great depression.
Deflation Back In The News
It took a while but the "D-Word" is back in the news after a long hiatus. Bloomberg is reporting Deflation Threat Returns as Asset Markets Decline
As Federal Reserve Chairman Ben S. Bernanke and his global colleagues fight the worst financial crisis since the 1930s, one danger is looming larger by the day: deflation.
The deflation scenario might go like this: Banks worldwide, stung by $588 billion in writedowns related to toxic assets -- especially mortgage-related securities -- will further reduce the flow of credit, strangling growth. That will push house prices lower, forcing additional losses and making banks even more reluctant to lend. As the credit crisis worsens, businesses will find it almost impossible to raise prices.
Prices are already falling in parts of the world economy. Home values dropped more than 10 percent in the U.K. and in the U.S. in the past year. Oil, copper and corn drove commodities toward their biggest weekly decline since at least 1956 on Oct. 3, with the Reuters/Jefferies CRB Index of 19 raw materials tumbling 10.4 percent. The Baltic Dry Index, a measure of commodity shipping costs, has dropped 75 percent since May.
Prices manufacturers paid for materials last month plunged the most since at least 1948, with the Institute for Supply Management's index dropping 23.5 points to 53.5 points.
Deflation may be back in the news, but the context is still incorrect. Falling prices are only a symptom of deflation, and not even a mandatory one. Deflation properly defined is a net reduction in money supply and credit, so let's take a look at at base money supply , courtesy of the St. Louis Fed.
Adjusted Monetary Base
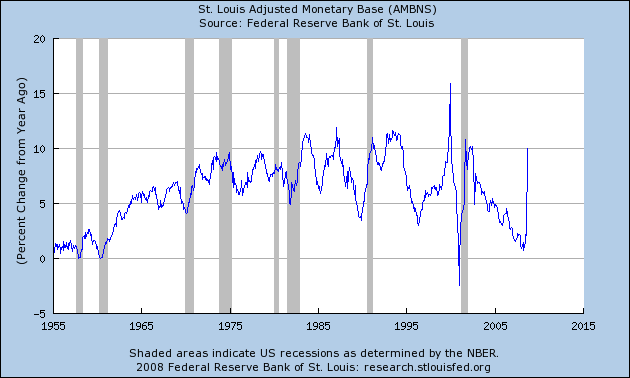
The above charts shows the Fed went on a recent printing spree. However, that printing spree is dwarfed by the decline in the value of credit marked to market on the books of banks and brokerages. Unfortunately I cannot prove a decline in marked to market credit because the SEC has suspended mark to market rules.
However, one can judge by actions, and the Fed in particular, and global central banks in general are in easily verifiable panic mode over the ongoing credit crunch.
Nearly Everything Consistent With Deflation
Commodities are sinking, the dollar is strengthening, the stock market is getting crucified, treasuries are rallying, jobs have contracted for 9 straight months with no end in sight, banks do not trust each other, consumer spending is declining, foreclosures are soaring, the TED Spread (3 month Treasury vs. 3 month LIBOR) is at an all time high, and the Fed Funds Rate fell at the fastest rate in history.
That list does not prove deflation, but it is consistent with what one would expect in deflation.
Given that gold is money, and money should do well in deflation, one would expect the purchasing power of gold to rise. The above charts show exactly that. Gold, especially in real terms is soaring.
So why have the miners gotten pounded? Hindsight may be 20-20 (or not) but here are a few possible explanations.
Mining stocks are leveraged compared to gold and a massive unwinding of that leverage is taking place, especially by hedge funds. There are now ongoing funding questions for some of the miners and explorers. There has been indiscriminate selling of virtually everything.
For more on how treasuries and gold should act in deflation, please see Treasuries and Gold Rise as Global Credit Freeze Prompts More Bailouts .
Those believing in stagflation, hyperinflation, or some sort of 70's rerun can now kiss those theories goodbye. Deflation is here and now, the only question now is how long it lasts.
By Mike "Mish" Shedlock
http://globaleconomicanalysis.blogspot.com
Click Here To Scroll Thru My Recent Post List
Mike Shedlock / Mish is a registered investment advisor representative for SitkaPacific Capital Management . Sitka Pacific is an asset management firm whose goal is strong performance and low volatility, regardless of market direction.
Visit Sitka Pacific's Account Management Page to learn more about wealth management and capital preservation strategies of Sitka Pacific.
I do weekly podcasts every Thursday on HoweStreet and a brief 7 minute segment on Saturday on CKNW AM 980 in Vancouver.
When not writing about stocks or the economy I spends a great deal of time on photography and in the garden. I have over 80 magazine and book cover credits. Some of my Wisconsin and gardening images can be seen at MichaelShedlock.com .
© 2008 Mike Shedlock, All Rights Reserved
Mike Shedlock Archive |
© 2005-2022 http://www.MarketOracle.co.uk - The Market Oracle is a FREE Daily Financial Markets Analysis & Forecasting online publication.