


Coronavirus Impact: Financial Markets Meltdown
Stock-Markets / Financial Markets 2020 Mar 13, 2020 - 09:02 AM GMTBy: Submissions

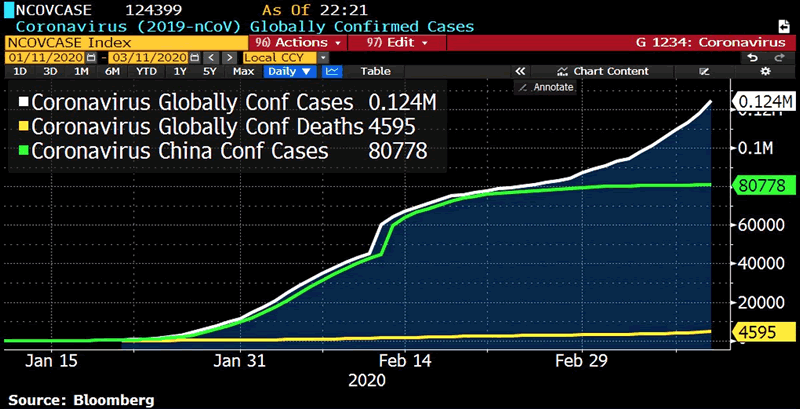
WHO declared coronavirus outbreak pandemic as confirmed cases top 124k globally. Meanwhile almost 4,600 are dead. Germany’s Merkel says 60-70% of population potentially at risk. Italy closes most stores. US has restricted non-essential travel from Europe.
As the virus toll starts to mount and increasingly panic spreads in the western world, there are rumors that US could mount a response similar to China visvis imposing marshall law. When we went short S&P500 at 3070, many of the clients did not believe but now no one would be laughing. The S&P500 could hit 2400 with ease and there is a potential of 2000 in forced liquidation.
It is best to trade with our managed account in such circumstances where human logic will not explain market moves. Our managed account run by Artificial Intelligence has been ahead of market and has made +26% in March along. To get started, simply register
On a longer term perspective, we see the state of the bull markets. Eleven years later, the bull market ends the way it began: in the middle of chaos and with very little warning. Read our earlier note : S&P will break 2600 with force
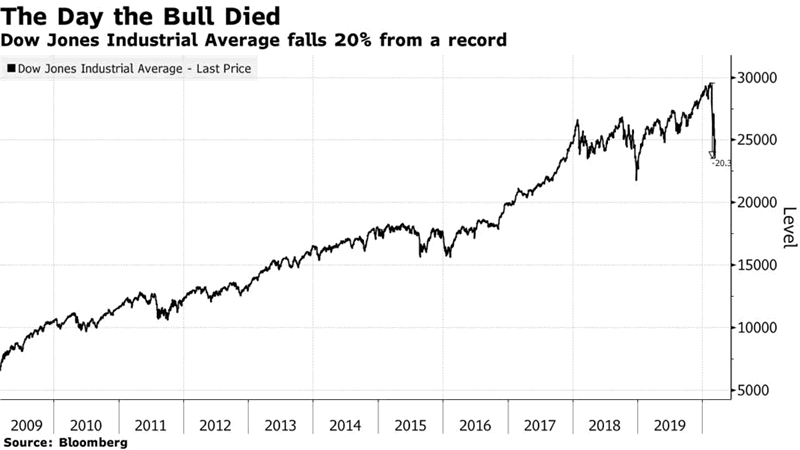
The sharp correction after being in touching distance of 30,000, the violence of the correction has taken many by surprise.
Markets latest: -Oil drops 5.6% after U.S. travel ban -Yen rises 1% against U.S. dollar -Hong Kong shares head into a bear market -U.S. futures extend losses, S&P 500 contracts down 3% -Euro stoxx 50 futures drop more than 7%
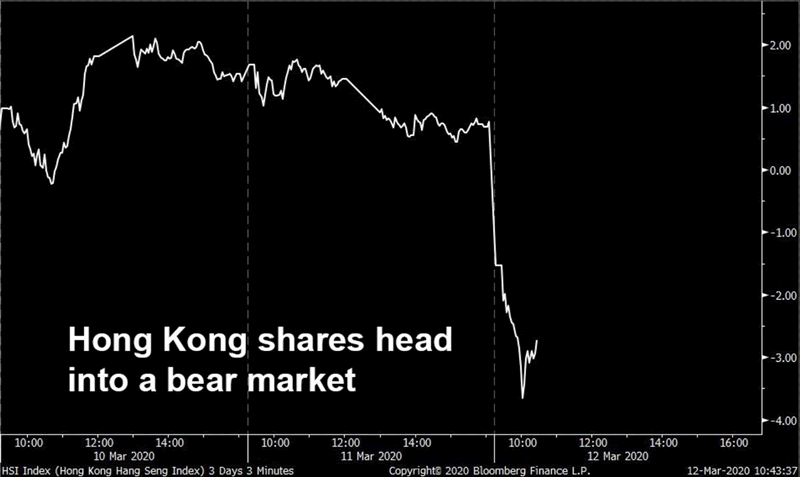
Asia this morning has been even more severe as US travel restrictions come into play.
S&P500
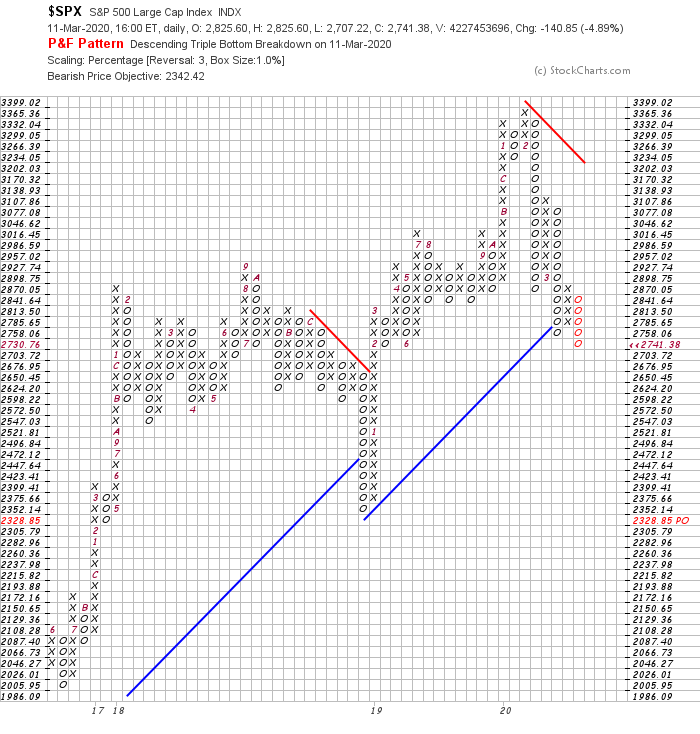
We had recommended clients to short US futures when it was at 3070. See our tradesheet here
The short trade is now at 2700 which is over 370 points of gain. The P&F charts have a target at 2350 but we will be getting out earlier.
WTI: Oil had a bearish target at 35.9
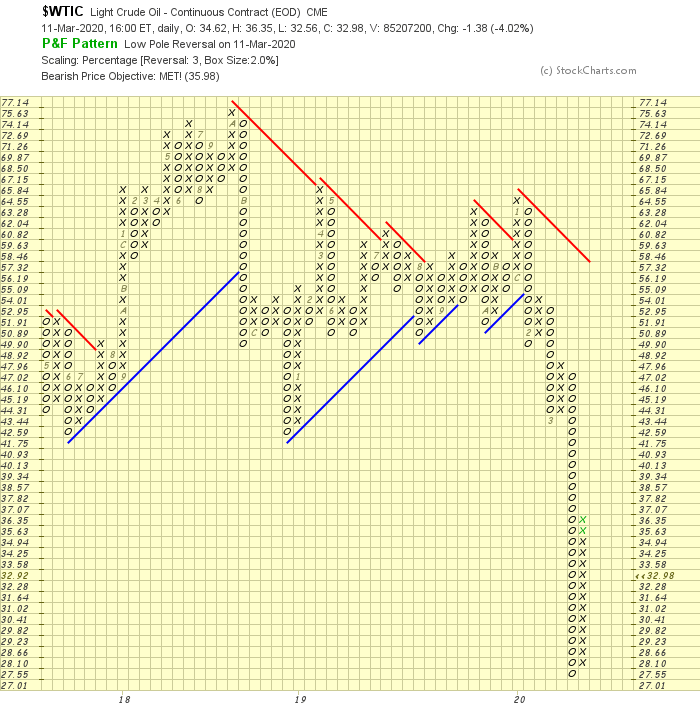
Our short trade on Oil at 46 to 36 was met this week.
Forex Analysis
EURUSD: Targeting 1.15
EUR/USD currently trading at 1.132
- EUR/USD is back above 1.13 amid risk-off mood in the global markets.
- Trump's coronavirus speech fell short of expectations and strengthened the demand for safe havens.
- With rates already below zero, the ECB has little room to deliver aggressive stimulus.
Risk aversion is again boding well for the single currency. EUR/USD pair is currently trading at 1.1317, representing a 0.42% gain on the day, while the Asian stocks, oil, and the S&P 500 futures are reporting sharp losses. The pair jumped from 1.1266 to 1.1334 in the 60 minutes to 02:00 GMT as the risk aversion in the stock markets worsened after President Trump failed to quell fears about a prolonged virus-led slowdown in the domestic and global economy. In his address to the nation at 01:00 GMT, Trump announced a 30-day travel ban on visitors from most of Europe and called on Congress to offer immediate payroll tax relief. Investors, however, were expecting stronger stimulus measures and sold risk aggressively following Trump's speech, boosting demand for safe havens like JPY, EUR and the US treasuries. With risk-off in full swing, the EUR/USD pair could continue to trade better bid in the run-up to the European Central Bank (ECB) rate decision, scheduled at 12:45 GMT. Focus on ECB
The central bank is stuck between a rock, a hard place, and the coronavirus and has limited scope to act, as noted by FXStreet's Yohay Elam. The rates are already below zero. As a result, any cut is unlikely to have a (positive) impact on the economy and may not yield a sustained weakness in the EUR. That said, markets are anticipating a cut in the deposit rate, which currently stands at -0.5%. Hence, the EUR could see a sharp rise if the central bank keeps rates unchanged. EURUSD-Daily charts
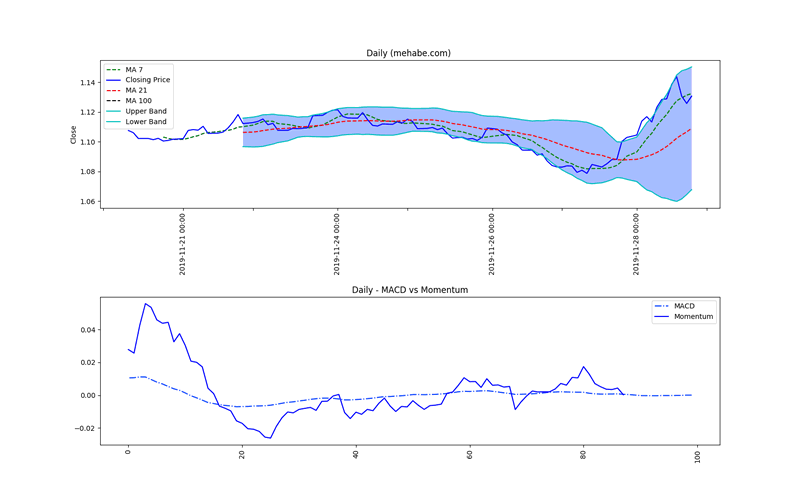
The pair opened at 1.1261 and closed at 1.1307 with a overall range of 76 pips. The high of the Daily timeframe was at 1.1334 while the low was at 1.1258. The price currently is trading at 1.1307. This is above the Daily 100 MA. The 100 MA is at 1.1067. The last Daily close was inside bollinger bands of 21 MA indicating that there may be balance of power between buyers and sellers. Unless a new move happens, clients are advised to be on the sideliness of this pair.
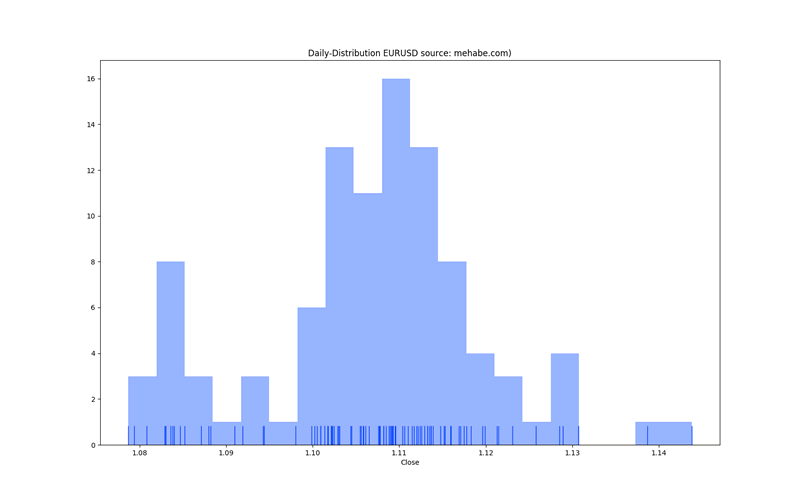
EURUSD-Daily Distribution charts
The following charts show the distribution of prices on daily time frame. Prices have a tendency to move towards the peak occurences which are often reflection of support and resistances.
Trade safe, keep stop losses, let winners run and cut losses is the three fold principle we follow in our managed account.
USD/JPY
USD/JPY currently trading at 103.38 Risk reversals on USD/JPY slip to record lows on rising demand for puts. A put option gives the holder a right to sell the underlying at an agreed price on or before a particular date. Put options (bearish bets) on USD/JPY continue to draw bids amid sustained risk aversion in the global equity markets. A one-month risk reversal, a gauge of calls to puts on the currency pair, has set a new record low of -8.90 for the fifth straight day, a sign of strengthening demand or implied volatility premium for put options. The gauge first hit a record low on March 6 when it dropped from -2.925 to -4.425 and has witnessed a near-90 degree drop from -0.65 over the last three weeks. A negative number indicates the premium claimed by puts is higher than that for calls. That said, consecutive record lows in risk reversals are indicative of extreme bearish sentiment. In such cases, markets usually see a strong move in the opposite direction. USD/JPY is currently trading at 103.37, representing a 1.9% drop on the day. The pair topped out above 112.22 on Feb. 20 and fell to a low of 101.18 on Monday, following which a minor corrective bounce to 105.92 was seen.
USDJPY-Daily charts
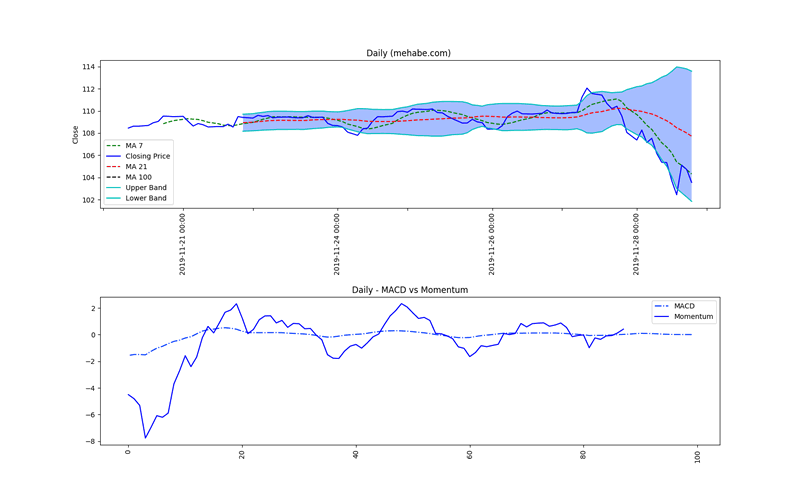
The pair opened at 104.54 and closed at 103.55 with a overall range of 1 pips. The high of the Daily timeframe was at 104.72 while the low was at 103.07. The price currently is trading at 103.55. This is below the Daily 100 MA. The 100 MA is at 108.94. The last Daily close was inside bollinger bands of 21 MA indicating that there may be balance of power between buyers and sellers. Unless a new move happens, clients are advised to be on the sideliness of this pair.
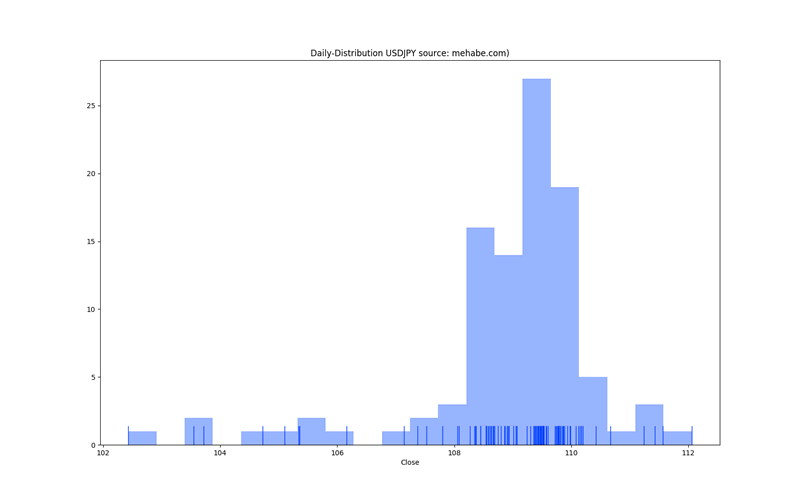
USDJPY-Daily Distribution charts
The following charts show the distribution of prices on daily time frame. Prices have a tendency to move towards the peak occurrences which are often reflection of support and resistances.
Trade safe, keep stop losses, let winners run and cut losses is the three fold principle we follow in our managed account.
PREMIUM MEMBERSHIP FREE REGISTER
Mehabe Managed Account The system return for March stand at a very high +26.6%. Full trade statement shown below. This is a AI enabled system running on the ECHO STATE NETWORK. So it thrives on volatility and trending and non-trending conditions. A quant based system will always surpass manual trading in that it is able to see system probability curves far better than human eyes. Every pair price action has a probability function which is near impossible for humans to detect. That is where Machine learning steps in and be able to train on trillion of data bytes to derive the pricing function.
To get started, you will need a NEW MT4 LIVE account: REGISTER HERE or if you already have a MT4 account, please check out the membership page
Any query can be directed to email fundsupport@mehabe.com
Mehabe is a Artificial Intelligence driven quantitative investing firm offering managed account, tradecopier and custom tailored investing solutions for global clients.
We have a history of industry leading performance.
Website: https://mehabe.com
Email : fundsupport@mehabe.com
Copyright 2020 © Mehabe.com - All Rights Reserved
Disclaimer: The above is a matter of opinion provided for general information purposes only and is not intended as investment advice. Information and analysis above are derived from sources and utilising methods believed to be reliable, but we cannot accept responsibility for any losses you may incur as a result of this analysis. Individuals should consult with their personal financial advisors.
© 2005-2022 http://www.MarketOracle.co.uk - The Market Oracle is a FREE Daily Financial Markets Analysis & Forecasting online publication.