


AI Fibonacci Trading System Predicts Next Stock Market Move
Stock-Markets / Stock Markets 2020 Apr 13, 2020 - 03:58 PM GMTBy: Chris_Vermeulen

Now that you’ve learned about Fibonacci Price Theory Part I and how major and minor Fibonacci Price Pivots help to map out true price structure Part II, we’ll continue our research article illustrating why we believe a deeper price low should take place before a true bottoms sets up in the US and global markets.
Our researchers use a host of available tools and proprietary price modeling systems in an attempt to identify the most likely outcome of future price activity. Within this article, we’re focusing on the Fibonacci Price Theory and our Adaptive Fibonacci Price Modeling system. We just taught you about Fibonacci Price Pivots and how to use them. Now, we are going to go into a detailed analysis of deeper Fibonacci price theory with the NQ (NASDAQ)
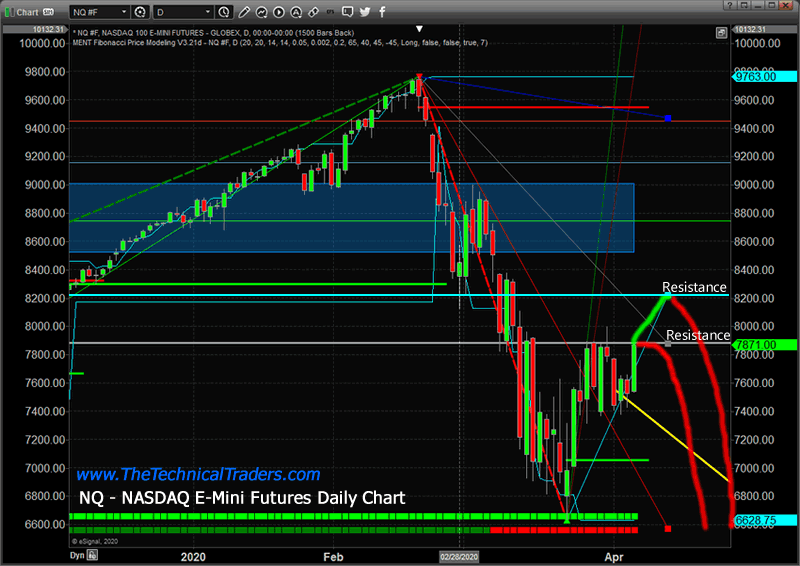
Daily Nasdaq Fibonacci Chart
This Daily NQ chart, below, should show you a whole new world if you are viewing the chart bars in the Fibonacci price structure. The recent highs in price, near 8000, have established a minor Fibonacci High Pivot. There is another minor Fibonacci High Pivot back near 9000 in the midst of the sell-off. There are others in this chart as well – see if you can find them.
The structure of price based on Fibonacci Price Theory continues to suggest that resistance will be found near the 7875 or the 8210 levels in the NQ that may prompt a strong Bearish price reversal. The NQ price would have to rally to levels above 9000, at this point, to qualify as a potential Bullish trend based on Fibonacci Price Theory. The minor price pivot high near 9000 can be interpreted at a Major Price Pivot because of the size of the downside price move.
Before we continue, be sure to opt-in to our free market trend signals before closing this page, so you don’t miss our next special report!
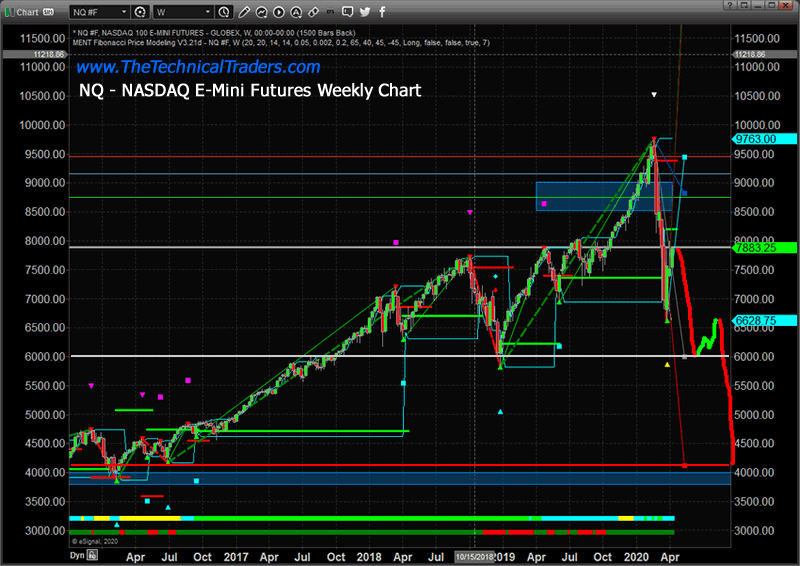
Weekly Nasdaq Fibonacci Chart
This last chart highlights our Weekly Adaptive Fibonacci Price Modeling system and shows the GREEN Trigger Line on the right side of the chart. The Bullish Trigger level on the NQ Weekly chart is at 8200. This suggests that the NQ price would have to rally and close above the 8200 level to have any type of early confirmation of a potential bullish price trend. If the price were to fail near 8200 and fall below this level, then the bullish trigger is negated.
You can see what our research team expects to happen by the drawn levels on the chart below. We believe a deeper price low must complete in order for the proper Fibonacci price structure to set up a bottom. The next Major low price pivot for the NQ is the 2018 low level near 5824. It is very likely that this level will become the next downside target should the current NQ price rally fail. Remember, failure to establish a new price high means price must attempt to establish a new price low.
A couple of weeks go I published a PDF guide on how to identify market trends both short-term and long-term using some basic indicators.
Concluding Thoughts:
If you are trying to call a bottom in this market, we urge you to move towards a safer stance in your investing style. We moved our clients into a nearly 100% cash position just before the peak in the markets. Since then, we’ve been very protective of assets and allocated only a small portion of our capital to new trade signals.
This is not the time to get married to any positions or trades. The markets can change in an instant and the volatility is still excessive (VIX above 40)
As a technical analyst and trader since 1997, I have been through a few bull/bear market cycles in stocks and commodities. I believe I have a good pulse on the market and timing key turning points for investing and short-term swing traders. 2020 is going to be an incredible year for skilled traders. Don’t miss all the incredible moves and trade setups.
I hope you found this informative, and if you would like to get a pre-market video every day before the opening bell, along with my trade alerts visit my Active ETF Trading Newsletter.
We all have trading accounts, and while our trading accounts are important, what is even more important are our long-term investment and retirement accounts. Why? Because they are, in most cases, our largest store of wealth other than our homes, and if they are not protected during a time like this, you could lose 25-50% or more of your entire net worth. The good news is we can preserve and even grow our long term capital when things get ugly like they are now and ill show you how and one of the best trades is one your financial advisor will never let you do because they do not make money from the trade/position.
If you have any type of retirement account and are looking for signals when to own equities, bonds, or cash, be sure to become a member of my Long-Term Investing Signals which we issued a new signal for subscribers.
Ride my coattails as I navigate these financial markets and build wealth while others lose nearly everything they own during the next financial crisis.
Chris Vermeulen
www.TheTechnicalTraders.com
Chris Vermeulen has been involved in the markets since 1997 and is the founder of Technical Traders Ltd. He is an internationally recognized technical analyst, trader, and is the author of the book: 7 Steps to Win With Logic
Through years of research, trading and helping individual traders around the world. He learned that many traders have great trading ideas, but they lack one thing, they struggle to execute trades in a systematic way for consistent results. Chris helps educate traders with a three-hour video course that can change your trading results for the better.
His mission is to help his clients boost their trading performance while reducing market exposure and portfolio volatility.
He is a regular speaker on HoweStreet.com, and the FinancialSurvivorNetwork radio shows. Chris was also featured on the cover of AmalgaTrader Magazine, and contributes articles to several leading financial hubs like MarketOracle.co.uk
Disclaimer: Nothing in this report should be construed as a solicitation to buy or sell any securities mentioned. Technical Traders Ltd., its owners and the author of this report are not registered broker-dealers or financial advisors. Before investing in any securities, you should consult with your financial advisor and a registered broker-dealer. Never make an investment based solely on what you read in an online or printed report, including this report, especially if the investment involves a small, thinly-traded company that isn’t well known. Technical Traders Ltd. and the author of this report has been paid by Cardiff Energy Corp. In addition, the author owns shares of Cardiff Energy Corp. and would also benefit from volume and price appreciation of its stock. The information provided here within should not be construed as a financial analysis but rather as an advertisement. The author’s views and opinions regarding the companies featured in reports are his own views and are based on information that he has researched independently and has received, which the author assumes to be reliable. Technical Traders Ltd. and the author of this report do not guarantee the accuracy, completeness, or usefulness of any content of this report, nor its fitness for any particular purpose. Lastly, the author does not guarantee that any of the companies mentioned in the reports will perform as expected, and any comparisons made to other companies may not be valid or come into effect.
Chris Vermeulen Archive |
© 2005-2022 http://www.MarketOracle.co.uk - The Market Oracle is a FREE Daily Financial Markets Analysis & Forecasting online publication.