


SP500 Kitchin Cycle Review
Stock-Markets / Stock Markets 2020 May 06, 2020 - 03:38 PM GMTBy: readtheticker

Early 2020 the fear was the human race 'David' may suffer terribly under a frightening new flu (COVID 19) 'Goliath', well after few short months it is now clear the human race will win this trial by combat.
Previous Post: SP500 Kitchin Cycle Review
In the previous post the blog said (part 1)
.."We must conclude the major 900 period low is now in, and we are now in a up swing, which may top out ate 2020 or late 2021. Any future top out may only generate a 10% to 20% correction, of course this can be deemed very mild. This is expected, but the expected does not always play out."...
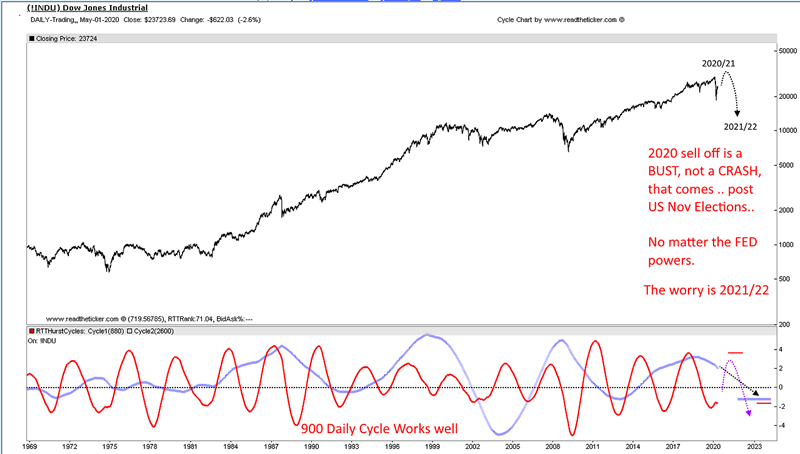
Well it sure did not, the flu lock downs around the world turned off economic activity and crushed the risk on asset price move. The end result is we finally got a true SP500 Kitchin low which we needed to finish the 900 daily cycle. (charts below). The result is some sort of short term US recession can be expected.
In the previous post the blog said (part 2)
.."Rolling the dice to get '7' does not always work. Post US elections seasonal's aligned with a poor start of the decade seasonal trends, add on high global recession risk, add on a stock market slump tends to occur in the years ending 9,1,2,3,4 (like 1973, 1982, 1991, 2001, 2009 are all recession years), markets may get very interesting."...
This still holds true, and we are not there yet.
Reminder ..
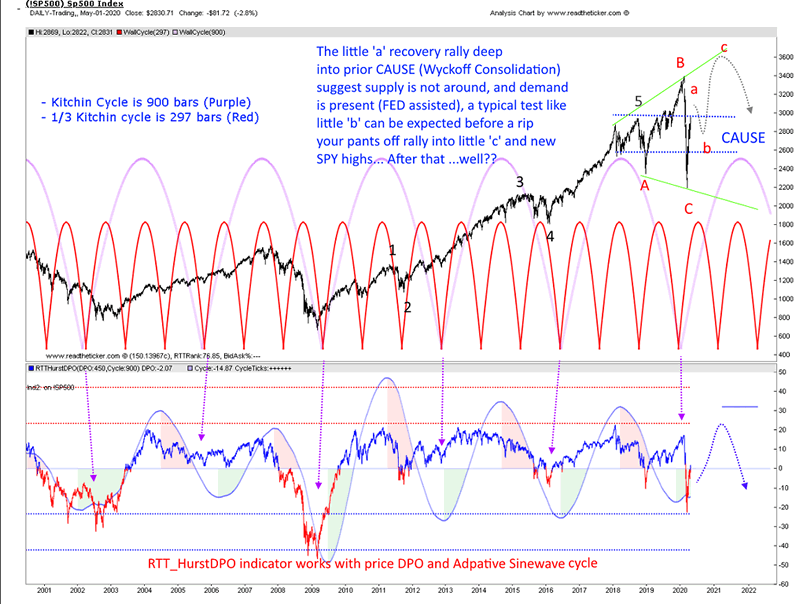
As a Wyckoff logic proponent we have to respect the demand behind the good volume little 'a' rally (chart below), because it made it easily into and passed the middle ground of the prior consolidation without attracting huge supply. This has to be considered a strength (minor strength, and yes demand is present).
Yes the price smash down from 'B' to 'C' was a typical sign of weakness of a serious note, but this like anything can be (temporary some say) over ruled. To be sure the little 'a' rally is true demand we must expect a successful test to little 'b' to ensure no supply is present, and once the supply judder bars are clear then its open season for a major strength move to little 'c'.
The coming little 'b' and 'c' moves will tell us (and volume behind them) if demand is healthy, but until then current price action has to be considered bullish [subject to little 'b' test confirmation of course].
Little 'b' test should not take out the low of big 'C', even better if it does not take out the low of big 'A', holding above 2600 would be even better.
The fundamentals behind the little a-b-c would be simply the bad news is known (kitchen sink news) and the market liquidity (via the FED) will find a home in risk on assets. The 2020 bearish smash is a bust rather than a crash starting a economic depression. Time will tell.
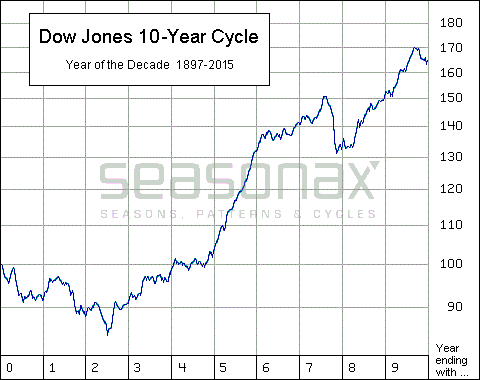
The Kitchin cycle has to be respected because as the historic DOW chart below shows it works.
The Kitchin cycle is a typical 900 period daily cycle (below the blog uses 880).
The chart above shows the fixed wall Kitchin cycle with the adaptive to price sine wave cycle via RTT custom indicator RTTHurstDPO.
The cycle charts suggest the real bearish market fun starts after 2020 year end.
Fundamentals are important, and so is market timing, here at readtheticker.com we believe a combination of Gann Angles, Cycles, Wyckoff and Ney logic is the best way to secure better timing than most, after all these methods have been used successfully for 70+ years. To help you applying Richard Wyckoff and Richard Ney logic a wealth of knowledge is available via our RTT Plus membership. NOTE: readtheticker.com does allow users to load objects and text on charts, however some annotations are by a free third party image tool named Paint.net Investing
NOTE: readtheticker.com does allow users to load objects and text on charts, however some annotations are by a free third party image tool named Paint.net
Readtheticker
My website: www.readtheticker.com
We are financial market enthusiast using methods expressed by the Gann, Hurst and Wyckoff with a few of our own proprietary tools. Readtheticker.com provides online stock and index charts with commentary. We are not brokers, bankers, financial planners, hedge fund traders or investment advisors, we are private investors
© 2020 Copyright readtheticker - All Rights Reserved
Disclaimer: The material is presented for educational purposes only and may contain errors or omissions and are subject to change without notice. Readtheticker.com (or 'RTT') members and or associates are NOT responsible for any actions you may take on any comments, advice,annotations or advertisement presented in this content. This material is not presented to be a recommendation to buy or sell any financial instrument (including but not limited to stocks, forex, options, bonds or futures, on any exchange in the world) or as 'investment advice'. Readtheticker.com members may have a position in any company or security mentioned herein.
© 2005-2022 http://www.MarketOracle.co.uk - The Market Oracle is a FREE Daily Financial Markets Analysis & Forecasting online publication.