


US Stock Prices are Ignoring the Economic Meltdown, Wait for it…
Stock-Markets / Stock Markets 2020 May 10, 2020 - 05:32 PM GMTBy: Chris_Vermeulen

Many months ago, our research team suggested any future collapse in the global markets would likely prompt a global capital shift in how capital identifies and is deployed for ROI. We’ve continued to suggest that the more mature, global economies will become beneficiaries of any massive global collapse event and that capital will actively seek out security and safety while attempt to attain moderate returns. We suggest reading this past research post on global central banks moves to keep the party rolling.
In 2019, we predicted a major Super-Cycle event would take place on or near August 19, 2019. We believed this event would prompt a major downside price rotation that would prompt a shift in how capital is deployed throughout the world’s financial markets. At that time, and still, we believe a long-term price cycle event is taking place which will prompt a deeper price bottom event that will likely complete near August or September 2020. This raises an interesting setup related to Technical Analysis for skilled traders…
If our analysis is correct, the Q2 and Q3 global economic data will be very distressing and likely prompt a continued downside price contraction in stock price levels and valuations. The disruption to the global economy has likely shaved 5% to 15% (or more) off total global GDP output for this year. Still, the US Fed and global central banks have poured more and more capital into the markets attempting to front-run this contraction in the global markets. We believe this “reprieve” in selling is likely temporary right now. The broader, longer-term, price cycle we’ve identified it still taking place and will likely prompt a deeper price bottom in the global markets before the end of 2020.
Before you continue, be sure to opt-in to our free market trend signals before closing this page, so you don’t miss our next special report & signal!
The one aspect of recent buying that we find rather interesting is that the NASDAQ (NQ) is really the only US market sector that is outperforming all the other sectors. This suggests that the US and global investors are piling into technology, biotech, and other NASDAQ symbols expecting these segments of the US economy to outperform the others. This is one component of the “capital shift” we have been warning investors about.
When the crisis event begins to unfold, capital (cash) will seek out and identify various opportunities as global markets and regional market segments shift from overvalued to undervalued – from risk to opportunity. We believe this is happening right now in the NASDAQ (NQ) and we believe the opportunity investors have piled into recently may turn into renewed risk in the near future as Q2 and Q3 economic data pushes reality into the markets.
Daily Comparison Chart shows the ES, YM, and NQ
This Daily Comparison Chart shows the ES, YM, and NQ in Log scale and highlights the collapse event for all three major indexes (almost in unison) as well as the incredible upside price rally in the NQ (RED) compared to the ES and YM. It is fairly easy to see how the NQ (RED Line) rallied over the past 30+ days much more efficiently than the ES and YM levels. As skilled traders were seeking opportunity, they identified the NQ as the best opportunity to deploy their capital.
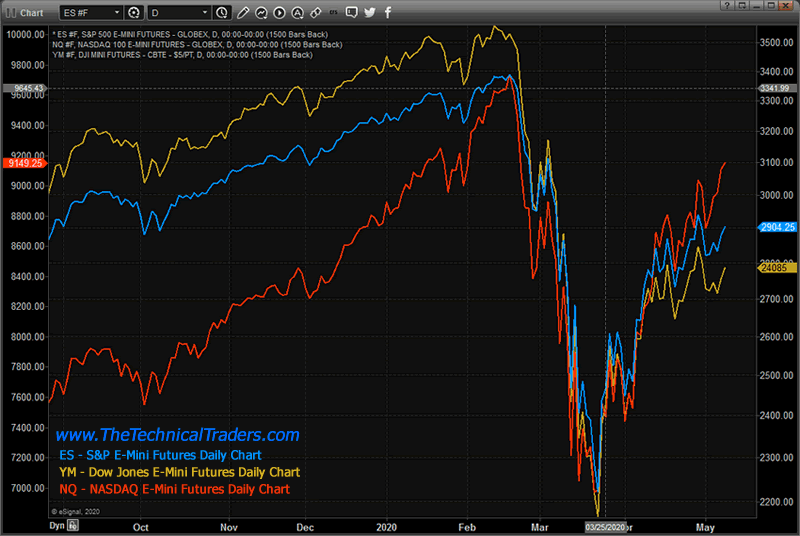
Yet, if our analysis is correct and a deeper price low will be necessary to complete the broader price cycle setup that is taking place, this also means the recent opportunity in the NQ may turn into excessive risk if the markets suddenly turn downward – targeting our predicted deeper price bottom.
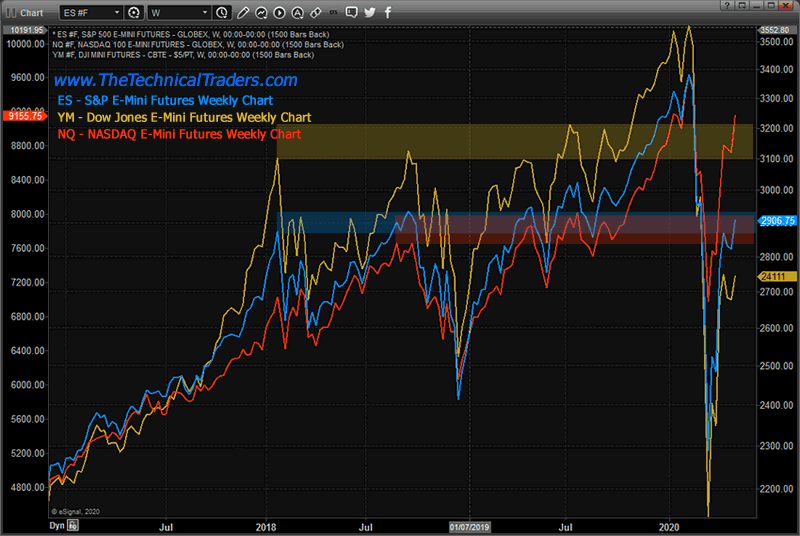
Weekly Comparison Chart shows the ES, YM, and NQ
This Weekly Comparison Chart shows the same three US major indexes and highlights previous price high levels which acted as resistance in the past. Both the ES and YM are currently trading below these resistance levels. The NQ is trading well above the resistance level (red). This continues to suggest that skilled traders have piled into the NQ rally expecting it to continue to outperform the S&P and Dow Jones in the future.
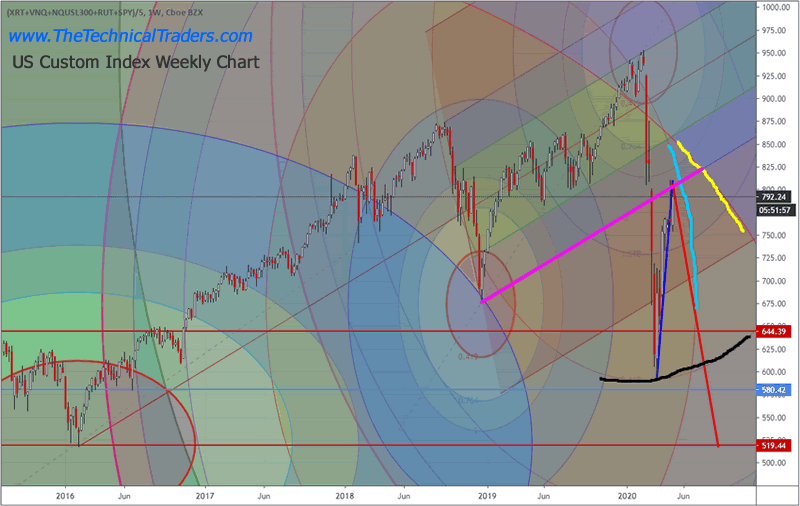
Weekly Custom US Index Chart
This Weekly Custom US Index chart helps to paint a very clear picture of the price trend and support/resistance levels that are active within the markets. In this chart, you’ll see many aspects of advanced technical analysis that helps us to determine where and when certain types of price action may take place. One of our tools is the Fibonacci Price Amplitude Arc technique – which attempts to deploy the Fibonacci price theory based on a price trend frequency/amplitude basis. This means each major and minor price trend (up or down) generates its own frequency/amplitude levels which project out in the past/future as key trigger levels for future price setups (tops/bottoms/rotations). We’ve also drawn a Std. Deviation Pitchfork across the 2018 top and bottom to highlight 1.0 and 2.0 Std. Deviation ranges related to current price peaks and bottoms.
As you can probably see from the chart, the deep lows in 2020 touched a broad Fibonacci Price Amplitude Arc registering a 2.618 expansion (highlighted in BLACK). Price has, subsequently, rallied back to the 1.0 StdDev lower price range on the Pitchfork. Additionally, there is a very important resistance price Arc that is setting up from the December 2018 price lows (highlighted in CYAN). Lastly, another major price resistance Arc originating from the 2016 lows aligns very closely with current price levels (highlighted in YELLOW).
Our researchers have identified a price inflection date trigger somewhere between May 8th and May 12th which we believe will prompt the start of a new trend or trend reversal trigger. We believe this inflection point suggests a bigger move will initiate near or shortly after this inflection point date. These types of inflection points typically result in larger volatility and/or broad price trend moves as they represent price breaking through resistance, support, or some major barrier in price. The energy it takes to break through these barriers translates into increased volatility and bigger price moves typically.
Currently, because of the technical setups we see that are about to trigger, we are very cautious in terms of taking unwanted risks in the markets related to trades. These inflection points could prompt a very big upside or downside price move within the next 5+ days and even though we believe the markets will attempt to move lower in a process that completes the deeper downside bottom formation, a “washout high” price rotation may occur as price reaches and breaches this inflection point.
In our view, it is better to wait for the market to confirm trends once this inflection point is processed to determine where the next opportunity for any new trade will present itself. As we’ve tried to highlight within this article, even though the NQ appears to be rallying back to near all-time highs, the major markets have set up a completely different set of technical analysis outcomes that suggest Q2 and Q3 weakness will likely prompt a deeper bottom pattern in the future.
The one thing we are certain of is that capital has already entered the “capital shift” process we have been suggesting over the past 24+ months. Capital will continue to roll into and out of various US and global market segments seeking safety, returns, and opportunity while attempting to avoid risks. We feel the US markets are very close to another topping event based on our research and believe waiting for clarity right now is the best decision skilled traders can make. One way or another, the market will tell us what to expect after breaking past this inflection point.
If you are using our free public research for your own trading decision-making and/or using it as an opportunity to find and execute successful trades, please remember you are the one ultimately making the decisions to trade based on our interpretation and free research posts. We, as technical traders, will continue to post new research articles and content that we believe is relevant to the current market setups.
If you want to improve your accuracy and opportunities for success, then we urge you to visit www.TheTechnicalTraders.com to learn how you can enjoy our research and our members-only trading triggers (see the first chart in this article). If you are managing your retirement account or 401k, then we urge you to visit www.TheTechnicalInvestor.com to learn how to protect your assets and grow your wealth using our proprietary longer-term modeling systems. Our goal is to help you find and create success – not to confuse you.
Our researchers will generate free research on just about any topic that interests them. As technical traders, we follow price, predict future price moves, tops, bottoms, and trends, and attempt to highlight incredible setups that exist on the charts. What you do with it is up to you. Visit www.TheTechnicalTraders.com/FreeResearch/ to review all of our detailed free research posts.
In closing, we would like to suggest that the next 5+ years are going to be incredible opportunities for skilled traders. Remember, we’ve already mapped out price trends 10+ years into the future that we expect based on our advanced predictive modeling tools. If our analysis is correct, skilled traders will be able to make a small fortune trading these trends and Metals will skyrocket. The only way you’ll know which trades to take or not is to become a member.
Chris Vermeulen
www.TheTechnicalTraders.com
Chris Vermeulen has been involved in the markets since 1997 and is the founder of Technical Traders Ltd. He is an internationally recognized technical analyst, trader, and is the author of the book: 7 Steps to Win With Logic
Through years of research, trading and helping individual traders around the world. He learned that many traders have great trading ideas, but they lack one thing, they struggle to execute trades in a systematic way for consistent results. Chris helps educate traders with a three-hour video course that can change your trading results for the better.
His mission is to help his clients boost their trading performance while reducing market exposure and portfolio volatility.
He is a regular speaker on HoweStreet.com, and the FinancialSurvivorNetwork radio shows. Chris was also featured on the cover of AmalgaTrader Magazine, and contributes articles to several leading financial hubs like MarketOracle.co.uk
Disclaimer: Nothing in this report should be construed as a solicitation to buy or sell any securities mentioned. Technical Traders Ltd., its owners and the author of this report are not registered broker-dealers or financial advisors. Before investing in any securities, you should consult with your financial advisor and a registered broker-dealer. Never make an investment based solely on what you read in an online or printed report, including this report, especially if the investment involves a small, thinly-traded company that isn’t well known. Technical Traders Ltd. and the author of this report has been paid by Cardiff Energy Corp. In addition, the author owns shares of Cardiff Energy Corp. and would also benefit from volume and price appreciation of its stock. The information provided here within should not be construed as a financial analysis but rather as an advertisement. The author’s views and opinions regarding the companies featured in reports are his own views and are based on information that he has researched independently and has received, which the author assumes to be reliable. Technical Traders Ltd. and the author of this report do not guarantee the accuracy, completeness, or usefulness of any content of this report, nor its fitness for any particular purpose. Lastly, the author does not guarantee that any of the companies mentioned in the reports will perform as expected, and any comparisons made to other companies may not be valid or come into effect.
Chris Vermeulen Archive |
© 2005-2022 http://www.MarketOracle.co.uk - The Market Oracle is a FREE Daily Financial Markets Analysis & Forecasting online publication.