


NASDAQ Sets Up A Massive Head and Shoulders Pattern
Stock-Markets / Tech Stocks May 14, 2020 - 12:02 PM GMTBy: Chris_Vermeulen

Our research team has identified a potential trade setup in QID that correlates to our ongoing analysis of the US stock market and our Advanced Fibonacci Price Amplitude Arcs. We believe a major price inflection point is setting up in the US stock market within the next 48 hours that may prompt a price trend reversal in the NASDAQ and other major US stock market indexes. This pattern correlates to a much longer-term Head-n-Shoulders pattern that is also setting up in the SPY.
Our belief is that technical traders should wait for confirmation of this setup before entering any new trades, yet we believe we will have confirmation of this setup within 3 to 5 trading days – given the urgency of the setup with our Fibonacci Price Amplitude Arcs. We believe a right-shoulder could be forming as the US stock markets push a bit higher in early trading this week. We believe the Fibonacci Price Acr’s are suggesting a major inflection point is preparing to disrupt price trends.
Just to be clear, this is a prediction, and as technical traders, we wait for confirmation before trading. This is the #1 issue with most traders. They jump the gun and buy into a trade idea before the price chart has confirmed and they lose a lot of money. Follow price, don’ try to lead it.
If our analysis is correct, we may see a fairly strong trend reversal over the next 5+ trading days as this pattern/setup complete and confirm.
Before you continue, be sure to opt-in to our free-market trend signals before leaving this page, so you don’t miss our next special report & signal!
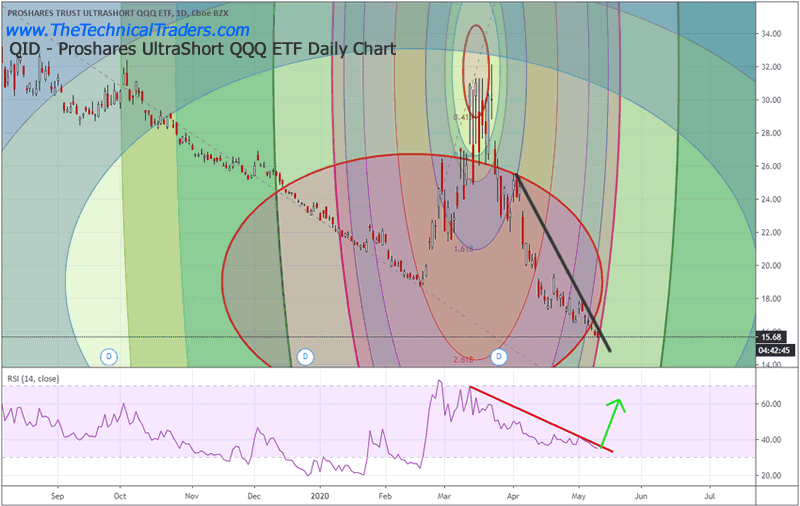
Daily QID (Inverse Nasdaq ETF) Chart
This Daily QID chart highlights the major RED Fibonacci Price Amplitude Arc that is setting up as well as the more narrow MAGENTA Arc. Both of these arcs are aligning very close to one another. Additionally, the RSI suggests any trend reversal to the upside could prompt a moderately large upside price trend.
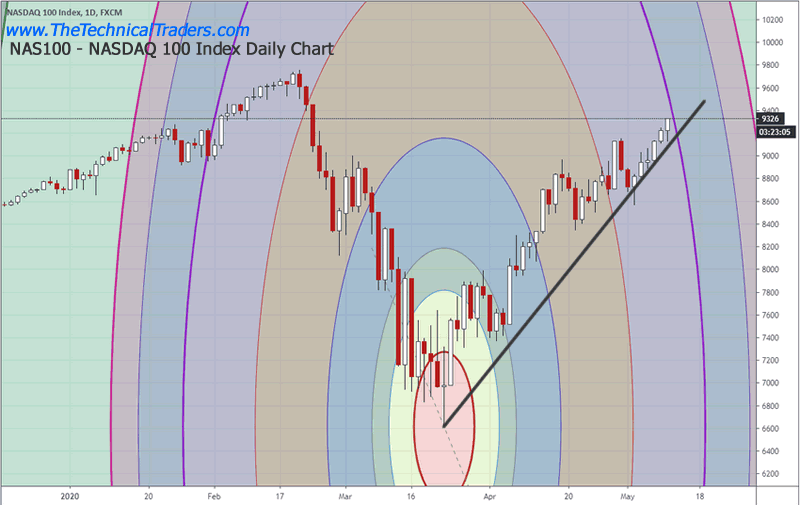
NAS100 Daily Chart
This NAS100 Daily chart highlights the right-shoulder of a longer-term price pattern that we believe may be ending soon. If our analysis is correct, the right-side of the Head-n-Shoulders pattern may set up near the PURPLE Arc on this chart (or soon after) – prompting a broad downside price trend in the US stock market.
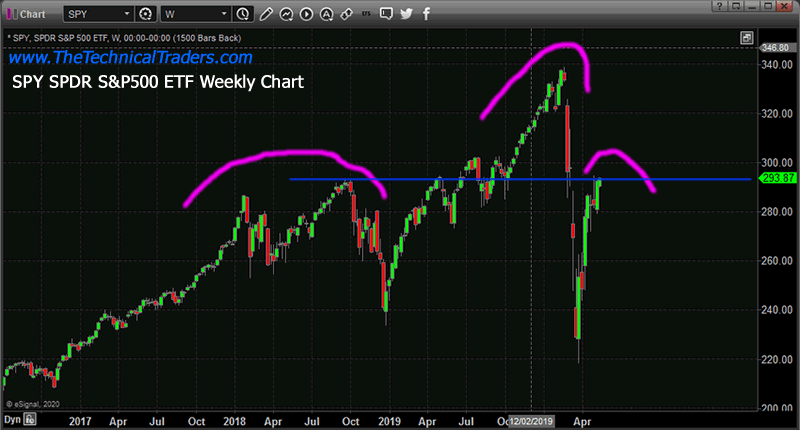
Longer-Term Weekly SPY chart
This longer-term Weekly SPY chart shows the Head-n-Shoulder setup that is forming in the SPY. Although the right side of the shoulder is rather short and volatile, we believe this setup may be a fairly strong potential pattern warning of a stronger downside price trend that may initiate soon. Obviously, 240 (previous lows) would be an easy objective in the SPY if this happens.
Concluding Thoughts
Current price levels suggest a resistance level has been reached. If this resistance level persists in containing price and creates a Head-n-Shoulders pattern, there is a very strong likelihood that a broader downside price move may present real opportunities for profits. Skilled traders should prepare for this potential and watch for confirmation of this pattern/setup.
If you are using our free public research for your own trading decision-making and/or using it as an opportunity to find and execute successful trades, please remember you are the one ultimately making the decisions to trade based on our interpretation and free research posts. We, as technical traders, will continue to post new research articles and content that we believe is relevant to the current market setups.
If you want to improve your accuracy and opportunities for success, then we urge you to visit www.TheTechnicalTraders.com to learn how you can enjoy our research and our members-only trading triggers (see the first chart in this article). If you are managing your retirement account or 401k, then we urge you to visit www.TheTechnicalInvestor.com to learn how to protect your assets and grow your wealth using our proprietary longer-term modeling systems. Our goal is to help you find and create success – not to confuse you.
Our researchers will generate free research on just about any topic that interests them. As technical traders, we follow price, predict future price moves, tops, bottoms, and trends, and attempt to highlight incredible setups that exist on the charts. What you do with it is up to you. Visit www.TheTechnicalTraders.com/FreeResearch/ to review all of our detailed free research posts.
In closing, we would like to suggest that the next 5+ years are going to be incredible opportunities for skilled traders. Remember, we’ve already mapped out price trends 10+ years into the future that we expect based on our advanced predictive modeling tools. If our analysis is correct, skilled traders will be able to make a small fortune trading these trends and Metals will skyrocket. The only way you’ll know which trades to take or not is to become a member.
Chris Vermeulen
www.TheTechnicalTraders.com
Chris Vermeulen has been involved in the markets since 1997 and is the founder of Technical Traders Ltd. He is an internationally recognized technical analyst, trader, and is the author of the book: 7 Steps to Win With Logic
Through years of research, trading and helping individual traders around the world. He learned that many traders have great trading ideas, but they lack one thing, they struggle to execute trades in a systematic way for consistent results. Chris helps educate traders with a three-hour video course that can change your trading results for the better.
His mission is to help his clients boost their trading performance while reducing market exposure and portfolio volatility.
He is a regular speaker on HoweStreet.com, and the FinancialSurvivorNetwork radio shows. Chris was also featured on the cover of AmalgaTrader Magazine, and contributes articles to several leading financial hubs like MarketOracle.co.uk
Disclaimer: Nothing in this report should be construed as a solicitation to buy or sell any securities mentioned. Technical Traders Ltd., its owners and the author of this report are not registered broker-dealers or financial advisors. Before investing in any securities, you should consult with your financial advisor and a registered broker-dealer. Never make an investment based solely on what you read in an online or printed report, including this report, especially if the investment involves a small, thinly-traded company that isn’t well known. Technical Traders Ltd. and the author of this report has been paid by Cardiff Energy Corp. In addition, the author owns shares of Cardiff Energy Corp. and would also benefit from volume and price appreciation of its stock. The information provided here within should not be construed as a financial analysis but rather as an advertisement. The author’s views and opinions regarding the companies featured in reports are his own views and are based on information that he has researched independently and has received, which the author assumes to be reliable. Technical Traders Ltd. and the author of this report do not guarantee the accuracy, completeness, or usefulness of any content of this report, nor its fitness for any particular purpose. Lastly, the author does not guarantee that any of the companies mentioned in the reports will perform as expected, and any comparisons made to other companies may not be valid or come into effect.
Chris Vermeulen Archive |
© 2005-2022 http://www.MarketOracle.co.uk - The Market Oracle is a FREE Daily Financial Markets Analysis & Forecasting online publication.