Stock Market Critical Price Level Could Soon Prompt A Big Move
Stock-Markets / Stock Markets 2020 May 25, 2020 - 05:43 PM GMTBy: Chris_Vermeulen
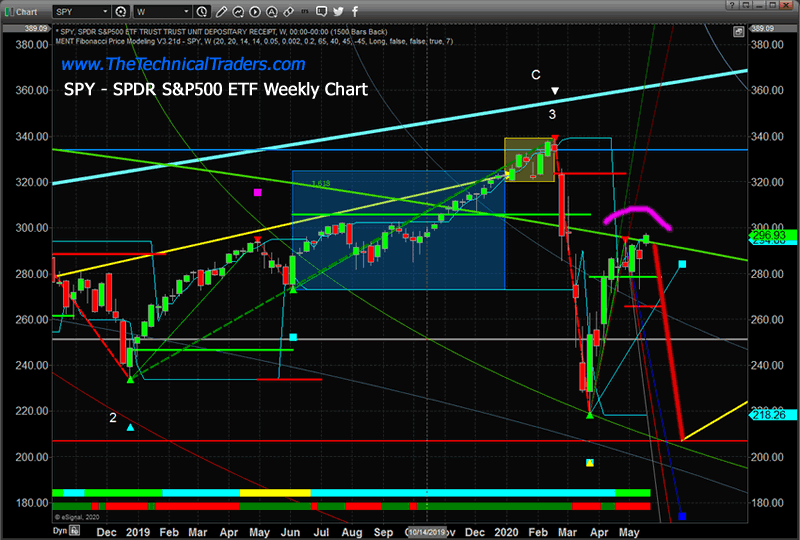
As technical traders and researchers, we’ve been paying very close attention to the GREEN ARC Fibonacci resistance level on the SPY as a key level for the US stock market and any hope of a continued upside price rally. The SPY has traded near this level for the past three weeks and appears to be attempting a bit of an upside breakout right now. Yet, we understand a long holiday weekend is upon us in the US, Memorial Day, and after a big upside GAP on Monday, the US stock market has stalled over the past few days.
Our researchers believe this GREEN ARC is still acting as critical price resistance and believe the SPY may sell off into the end of the week resulting in a failed attempt to breach this key resistance level. If this happens, the failed attempt to break this resistance could prompt a change in price trend and initiate a new downside price trend. If this resistance level is broken by the end of this week, then we have a pretty solid indicator that continued bullish price trending may continue.
Absent of any real news that may drive the market trend this holiday weekend and with most of the US still in shutdown mode, we believe the US stock market has continued to trade within this no man’s land area for many weeks now. From the end of April till now, we’ve seen moderate upside price action in certain sectors, yet other sectors continue to show signs of weakness.
SPDR S&P500 ETF WEEKLY CHART

Before we continue, be sure to opt-in to our free-market trend signals before closing this page, so you don’t miss our next special report!
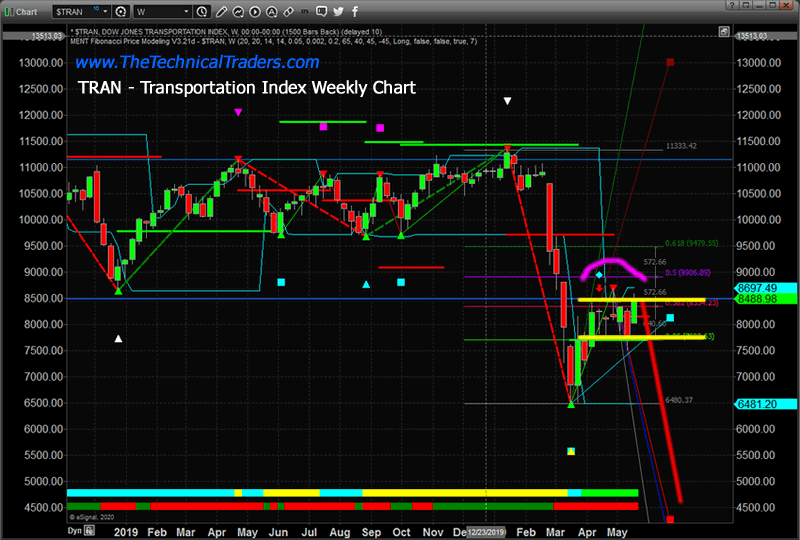
TRANSPORTATION INDEX WEEKLY CHART
This Transportation Index Weekly chart is a perfect example of the weakness that is evident away from the S&P500, NASDAQ, and Dow Industrials. Compare the last 6+ weeks of trading on this TRAN chart to the SPY chart above. Notice that the TRAN chart shows a very congested sideways price channel (highlighted in YELLOW) as well as a much deeper upside price move from the lows near March 20. While the US major indexes have rallied substantially, the broader market indexes are not experiencing the upside price advance and continue to suggest overall weakness.
This disconnect in the markets suggests speculation is driving the US major indexes higher and not real fundamental appreciation based on earnings and revenues. When this speculation ends, typically when speculators realize the price has been driven a bit too high compared to reality, then the trend can change in an instant.

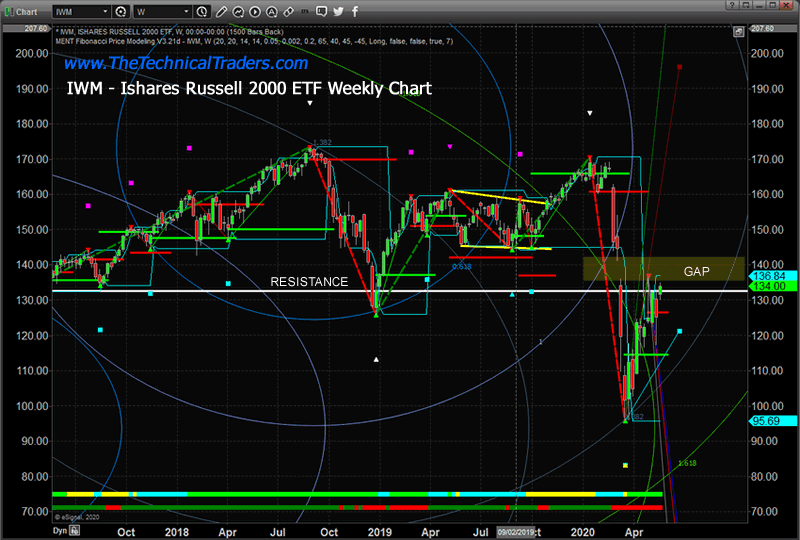
ISHARES RUSSELL 2000 ETF WEEKLY CHART
This IWM Russell 2000 ETF Weekly chart highlights a similarly week upside price rally since the March 20th bottom. The WHITE LINE on this chart represents a support/resistance level from early trading low price levels in 2017. Our research team believes these levels represent a very important support/resistance level for the Russell 2000 ETF as this level coincides with the GAP in price that was generated within the recent selloff on March 9, 2020. That GAP cleared this key support/resistance level with a very big downside price move. We believe this level will act as intense resistance as price attempts to fill the GAP.

Concluding Thoughts:
Overall, the US stock market has continued to trade within this no man’s land recently. There have been some pretty decent upside price moves in certain sectors over the past few weeks. Precious metals, certain travel/leisure stocks, and, of course, technology and services stocks. Yet, we continue to warn our friends and followers to be very aware that the US stock market is far from immune to more downside price activity. A deep selloff like we experienced will very often react with a “recovery move” – a dead cat bounce type of move. While the NQ has been a big mover, these other sectors suggest we may be nearing a tipping point and we urge technical traders to stay very aware of the risks as we head into this long holiday weekend.
I’ve been trading since 1997 and I’ve lived through numerous market events. The one thing I teach my members is that risk is always a big part of trading and that’s why I structure all of my research and trading signals around “finding profits while reducing overall risks”. Sure, there are fast profits to be made in these wild market swings, but those types of trades are extremely risky for most people – and I don’t know of anyone that wants to risk 50 or 60% of their assets on a few wild trades.
You don’t have to spend days or weeks trying to learn my system. You don’t have to try to learn to make these decisions on your own or follow the markets 24/7 – I do that for you. All you have to do is follow my research and trading signals and start benefiting from my research and trades. My new mobile app makes it simple – download the app, sign in and everything is delivered to your phone, tablet, or desktop.
Please take a moment to visit www.TheTechnicalInvestor.com to learn more. I can’t say it any better than this… I want to help you create success while helping you protect and preserve your wealth – it’s that simple.
Chris Vermeulen
www.TheTechnicalTraders.com
Chris Vermeulen has been involved in the markets since 1997 and is the founder of Technical Traders Ltd. He is an internationally recognized technical analyst, trader, and is the author of the book: 7 Steps to Win With Logic
Through years of research, trading and helping individual traders around the world. He learned that many traders have great trading ideas, but they lack one thing, they struggle to execute trades in a systematic way for consistent results. Chris helps educate traders with a three-hour video course that can change your trading results for the better.
His mission is to help his clients boost their trading performance while reducing market exposure and portfolio volatility.
He is a regular speaker on HoweStreet.com, and the FinancialSurvivorNetwork radio shows. Chris was also featured on the cover of AmalgaTrader Magazine, and contributes articles to several leading financial hubs like MarketOracle.co.uk
Disclaimer: Nothing in this report should be construed as a solicitation to buy or sell any securities mentioned. Technical Traders Ltd., its owners and the author of this report are not registered broker-dealers or financial advisors. Before investing in any securities, you should consult with your financial advisor and a registered broker-dealer. Never make an investment based solely on what you read in an online or printed report, including this report, especially if the investment involves a small, thinly-traded company that isn’t well known. Technical Traders Ltd. and the author of this report has been paid by Cardiff Energy Corp. In addition, the author owns shares of Cardiff Energy Corp. and would also benefit from volume and price appreciation of its stock. The information provided here within should not be construed as a financial analysis but rather as an advertisement. The author’s views and opinions regarding the companies featured in reports are his own views and are based on information that he has researched independently and has received, which the author assumes to be reliable. Technical Traders Ltd. and the author of this report do not guarantee the accuracy, completeness, or usefulness of any content of this report, nor its fitness for any particular purpose. Lastly, the author does not guarantee that any of the companies mentioned in the reports will perform as expected, and any comparisons made to other companies may not be valid or come into effect.
Chris Vermeulen Archive |
© 2005-2022 http://www.MarketOracle.co.uk - The Market Oracle is a FREE Daily Financial Markets Analysis & Forecasting online publication.


