


Comparing Bitcoin to Other Market Sectors – Risk vs. Value
Stock-Markets / Financial Markets 2020 Jun 04, 2020 - 03:30 PM GMTBy: Chris_Vermeulen

Quite a few traders have been discussing the recent rally of Bitcoin to recently breach the $10,000 level on May 7, 2020. This psychological price level is a major milestone for Bitcoin – even though the price has fallen into an extended Flag/Pennant formation since reaching the recent peak. Many traders and speculators are expecting Bitcoin to rally alongside the precious metals sector as there appears to be a strong belief that Bitcoin aligns with precious metals well. Our researchers attempted to put this assumption into a simple test and this is what we found.
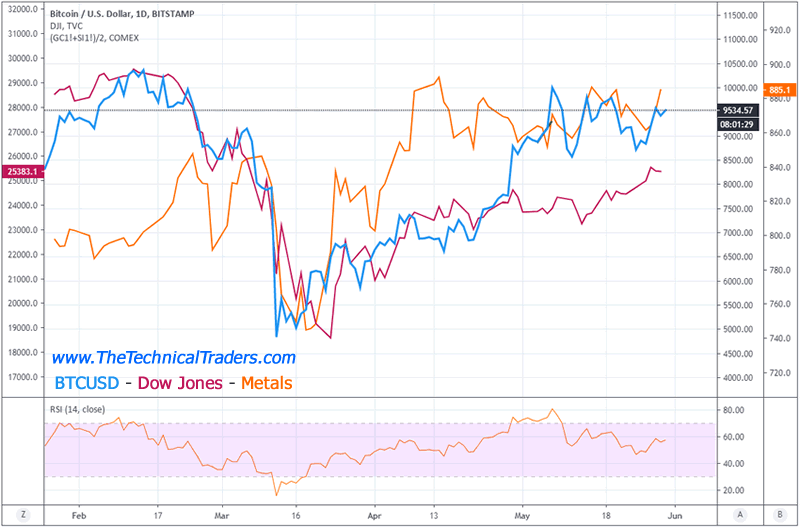
Bitcoin appears to be similarly volatile in comparison to precious metals, although the overall trending of Bitcoin has been moderately lower since the peak levels in February 2020 whereas the Gold/Silver sectors have seen advancing price activity over the same span of time. Precious metals rallied much quicker after the bottom near March 2020 whereas Bitcoin didn’t really begin to rally until late April 2020. Because of this disconnect in price association, we don’t believe Bitcoin is aligned with the precious metals segment.
Bitcoin doesn’t seem to be aligned with the price action of the Dow Jones either. Initially, after the peak in February 2020, the price alignment between Bitcoin and the DJI was almost in sync. A broader price disconnect appears to be more evident in late April where Bitcoin rallied and the Dow Jones stayed rather flat. Because of this shift in price alignment – we believe Bitcoin is not aligned with the Dow Jones well enough to derive any cross-market correlation.
BITCOIN – DOW JONES – METALS CHART
Before we continue, be sure to opt-in to our free-market trend signals before closing this page, so you don’t miss our next special report!
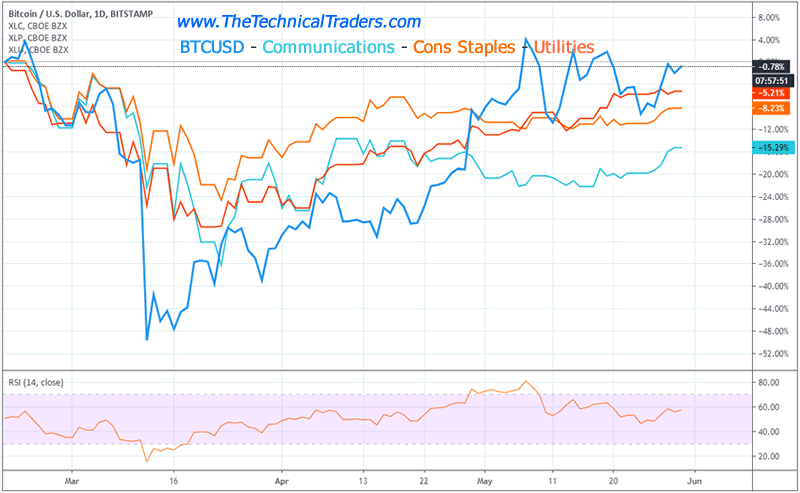
Additionally, we attempted to compare Bitcoin to major consumer sectors (communications, staples, and utilities) to see if we could find any measurable correlation to these sectors in relation to Bitcoin price activity. Again, the early price alignment of all of these seemed somewhat in-sync in the early downside price collapse in February 2020. Yet that alignment quickly deteriorated in early March 2020 as Bitcoin prices collapsed and bottomed while the consumer sectors continued to trend a bit lower until after March 20, 2020. The one thing we did notice is that the consumer sectors appear to be much less volatile than Bitcoin in both downside and upside price activity.
BITCOIN – COMMUNICATIONS – STAPLES – UTILITIES
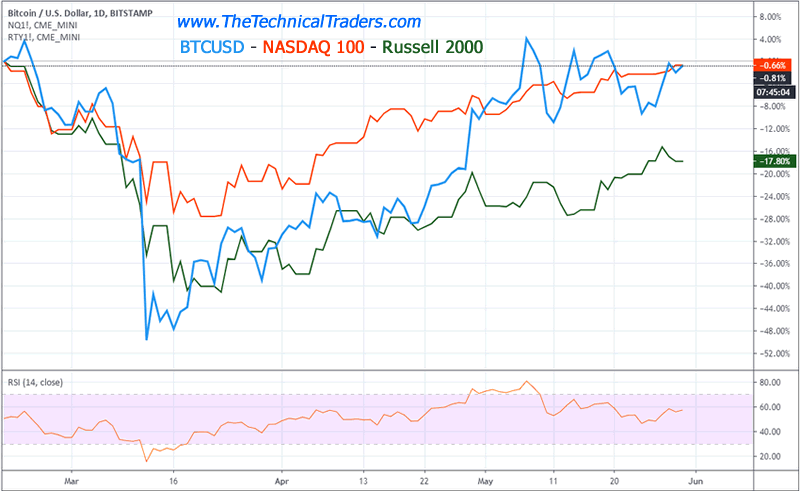
Lastly, we compared Bitcoin to the NASDAQ 100 and the Russell 2000 attempting to find any price correlation between these major market sectors. Although the price correlation is not perfect, our researcher believes Bitcoin is moderately closely correlated to the Russell 200 more than any other symbol/sector we have attempted to analyze. Many of the bigger, more prominent, upward, and downward price cycles/trends seems to align with the Russell 2000 price action (often within 1 or 2 days of the Bitcoin trends – if not immediately).
For example, the bottom/base near April 21 aligned almost perfectly between the two symbols, the rally starting near April 25 began 1 day apart on both symbols, the peak in price before a moderate selloff on March 26 happened on almost the same day for both symbols, the moderate upside peak before the big collapse on March 4 occurred only one day apart. Even though there is a broad price volatility difference between Bitcoin and the Russell 2000, the correlations between the two symbols seem much more aligned than any symbols we’ve attempted to run other comparisons.
We will add that appears a recent shift in price activity may be starting to disassociate Bitcoin to the Russell 2000 over the past 7+ days. Our researchers have identified the Russell 2000 (and other consumer sectors) appear to be attracting new investments from skilled technical traders while the major sectors appear to be weakening. We believe this is because capital is shifting away from already pricey assets and moving into undervalued assets that may do well as the recovery strengthens.
BITCOIN – NASDAQ 100 – RUSSELL 2000
Will Bitcoin continue to rally above the $10,000 level? Eventually, the answer to that question is “probably – yes”. The one thing we want to bring to our reader’s attention is the immediate downside price correlation of Bitcoin to all of the various sectors and symbols we’ve presented today. When a broader downside price collapse happens in the US/Global markets – it appears Bitcoin is not immune or considered a decentralized asset class in any form. Bitcoin seems much more aligned with the Dow Jones and/or the Russell 2000 than any other symbols/sectors.
Because of this alignment, we suggest traders watch the Dow Jones and the Russell 2000 for price trend correlations that may relate to how Bitcoin price activity may react in the near future. Until this correlation is broken, we believe the alignment in price is relatively predictable for skilled technical traders.
I hope you found this informative, and if you would like to get a pre-market video every day before the opening bell, along with my trade alerts. These simple to follow ETF swing trades have our trading accounts sitting at new high water marks yet again this week, not many traders can say that this year. Visit my Active ETF Trading Newsletter.
If you have any type of retirement account and are looking for signals when to own equities, bonds, or cash, be sure to become a member of my Long-Term Investing Signals which we issued a new signal for subscribers.
Ride my coattails as I navigate these financial markets and build wealth while others lose nearly everything they own during the next financial crisis.
Chris Vermeulen
www.TheTechnicalTraders.com
Chris Vermeulen has been involved in the markets since 1997 and is the founder of Technical Traders Ltd. He is an internationally recognized technical analyst, trader, and is the author of the book: 7 Steps to Win With Logic
Through years of research, trading and helping individual traders around the world. He learned that many traders have great trading ideas, but they lack one thing, they struggle to execute trades in a systematic way for consistent results. Chris helps educate traders with a three-hour video course that can change your trading results for the better.
His mission is to help his clients boost their trading performance while reducing market exposure and portfolio volatility.
He is a regular speaker on HoweStreet.com, and the FinancialSurvivorNetwork radio shows. Chris was also featured on the cover of AmalgaTrader Magazine, and contributes articles to several leading financial hubs like MarketOracle.co.uk
Disclaimer: Nothing in this report should be construed as a solicitation to buy or sell any securities mentioned. Technical Traders Ltd., its owners and the author of this report are not registered broker-dealers or financial advisors. Before investing in any securities, you should consult with your financial advisor and a registered broker-dealer. Never make an investment based solely on what you read in an online or printed report, including this report, especially if the investment involves a small, thinly-traded company that isn’t well known. Technical Traders Ltd. and the author of this report has been paid by Cardiff Energy Corp. In addition, the author owns shares of Cardiff Energy Corp. and would also benefit from volume and price appreciation of its stock. The information provided here within should not be construed as a financial analysis but rather as an advertisement. The author’s views and opinions regarding the companies featured in reports are his own views and are based on information that he has researched independently and has received, which the author assumes to be reliable. Technical Traders Ltd. and the author of this report do not guarantee the accuracy, completeness, or usefulness of any content of this report, nor its fitness for any particular purpose. Lastly, the author does not guarantee that any of the companies mentioned in the reports will perform as expected, and any comparisons made to other companies may not be valid or come into effect.
Chris Vermeulen Archive |
© 2005-2022 http://www.MarketOracle.co.uk - The Market Oracle is a FREE Daily Financial Markets Analysis & Forecasting online publication.