


Think Coronavirus Caused the Stock Market Crash? These Two Charts Beg to Differ
Stock-Markets / Stock Markets 2020 Jun 08, 2020 - 12:28 PM GMTBy: EWI

Just about everyone thinks the coronavirus pandemic slammed global stock prices in February and March. Entire countries shut down; businesses closed up shop; unemployment soared. People stopped spending money beyond the essentials, so conventional wisdom would indeed expect stocks to slide as a result. Yet consider the below chart of the Shanghai Composite, China's primary stock index.
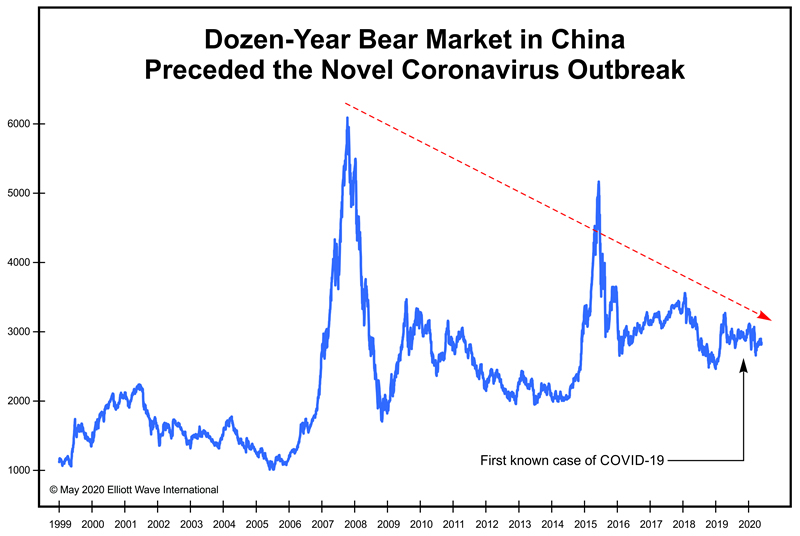
Far from prompting a new bear market, the chart shows that the novel coronavirus appeared in Wuhan after a dozen-plus years of net decline in Chinese stock prices. Did the bear market instead prompt the pandemic?
Before we answer, let's look at one more chart. The below chart shows the Dow Jones Industrial Average plotted against the daily number of new U.S. COVID-19 cases reported to the Centers for Disease and Prevention. The CDC's case count is a function of disease prevalence, testing capacity and social awareness of the virus.
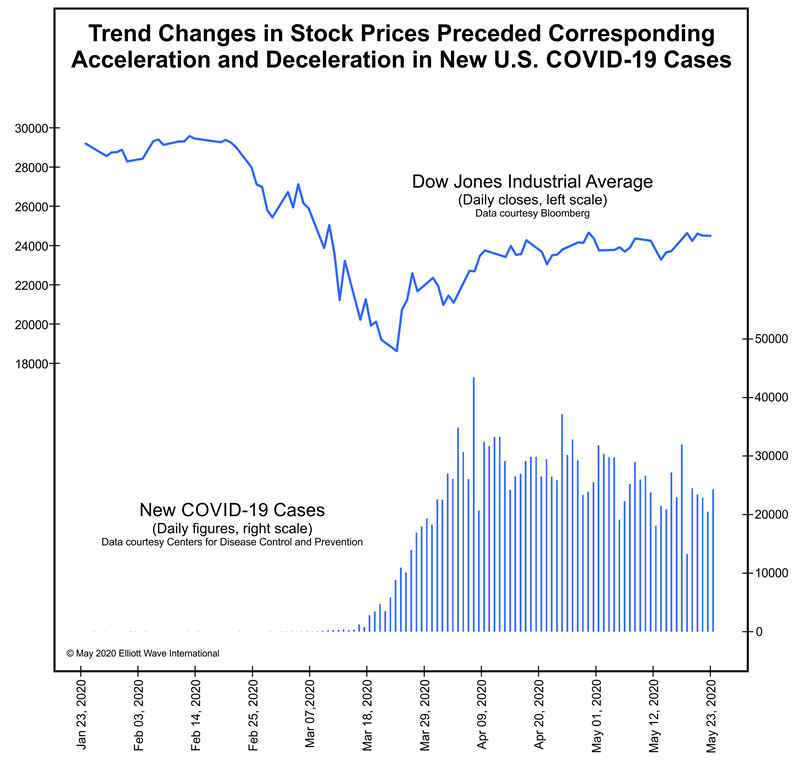
The Dow peaked on February 12 and began a precipitous fall, finishing the month down some 14% from its high. Yet the number of new daily COVID-19 cases essentially rounded to zero until March 3 when it hit double digits for the first time. Six days later the new daily case count reached triple digits for the first time; a week later new daily cases exceeded a thousand. By then, the Dow was already down more than 29% from its high. These data indicate that the fall in the Dow preceded the acceleration in confirmed new COVID-19 cases in the U.S., not the other way around.
The Dow registered a low on March 23, yet daily new COVID-19 cases continued to soar; on April 7, new cases peaked at 43,438. By then the Dow had already rebounded strongly, up 22% from its low. As the Dow continued higher in the following weeks, the number of new COVID-19 cases receded. These data indicate that the rise in the Dow from its March low preceded the decline in confirmed new COVID-19 cases in the U.S., not the other way around.
In summary: The market led, and the virus followed.
How can we make sense of these data? Robert Prechter's socionomic theory proposes that social mood regulates the aggregate tenor and character of social trends -- including the stock market and our collective susceptibility to epidemics. As social mood becomes more negative, society sends stock prices lower and becomes more vulnerable to epidemics. As social mood becomes more positive, society sends stock prices higher and becomes less vulnerable to epidemics.
Because society's mood changes are swiftly reflected by the stock market, its trends tend to precede those of other mood manifestations. Thus major epidemics generally emerge or accelerate in countries after large-degree bear markets begin, a proposition which more than a century and a half of history supports.
We can also use socionomics to understand why the world was so unprepared for the coronavirus pandemic. Pundits place the blame on leaders, institutions and the absence of information. But a report from the May 2020 issue of The Socionomist goes deeper to reveal the true source of society's complacency. It also illuminates how to use the stock market to identify when further risks to our lives and livelihoods are likely to intensify. You can read the entire issue when you join ClubEWI, the world's largest Elliott wave educational community. Membership is free. Follow this link to join.
This article was syndicated by Elliott Wave International and was originally published under the headline . EWI is the world's largest market forecasting firm. Its staff of full-time analysts led by Chartered Market Technician Robert Prechter provides 24-hour-a-day market analysis to institutional and private investors around the world.
© 2005-2022 http://www.MarketOracle.co.uk - The Market Oracle is a FREE Daily Financial Markets Analysis & Forecasting online publication.