


Silver/Gold Ratio Hits Target; About Those Inflation Indicators
Commodities / Gold & Silver 2020 Jun 08, 2020 - 12:57 PM GMTBy: Gary_Tanashian

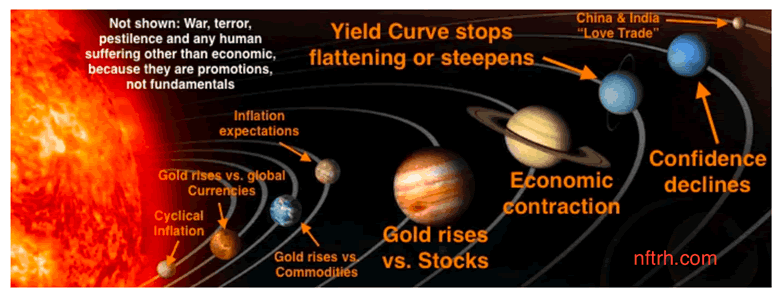
The NFTRH plan is and has been that the gold mining sector, due to the fundamentals implied by the handy graphic below, could eventually lead a world full of inflatables higher. The miners, leveraging gold’s out performance to most everything else during liquidity crises and even deflation, move first and draw in the inflationist bugs later. If the macro goes inflationary the miners will likely continue to perform well (ref. the 2003-2008 period) but would no longer be the go-to sector.
Then the play theoretically spreads far afield into commodities, global stocks (e.g. EM, Asia, etc.) and US markets/sectors that tend to benefit from the rising long-term yields (e.g. banks, materials, etc.) resulting from inflationary macro signaling. These would be aspects of a sustainable inflation/reflation trade IF the signals are in order. So let’s take a look at some of them.
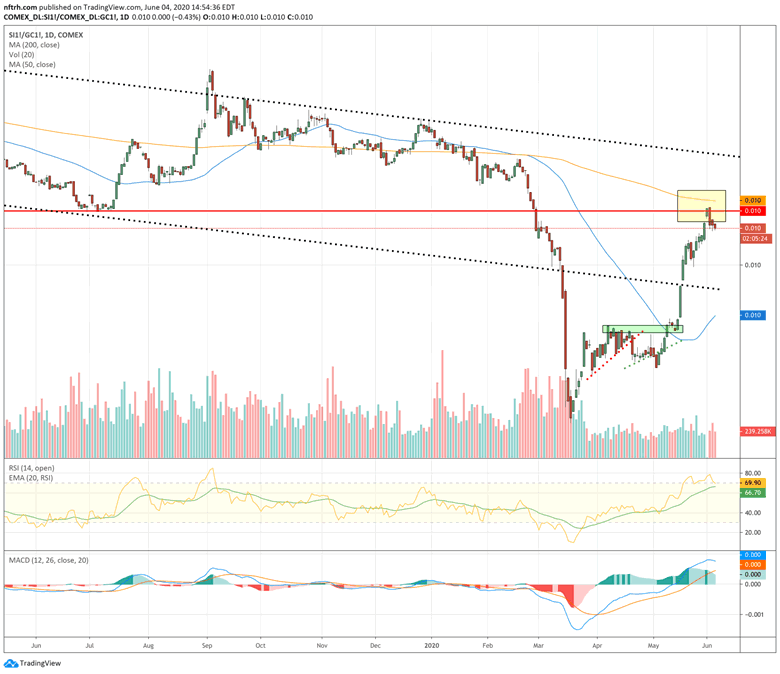
The Silver/Gold Ratio (SGR), a reflationary risk ‘on’ indicator has hit our upside target, which we have tracked in NFTRH updates over the last few weeks using the yellow box highlighting an area near the down-trending 200 day moving average that would at least temporarily halt the party. The SGR is pausing and pulling back a bit here. All normal so far.
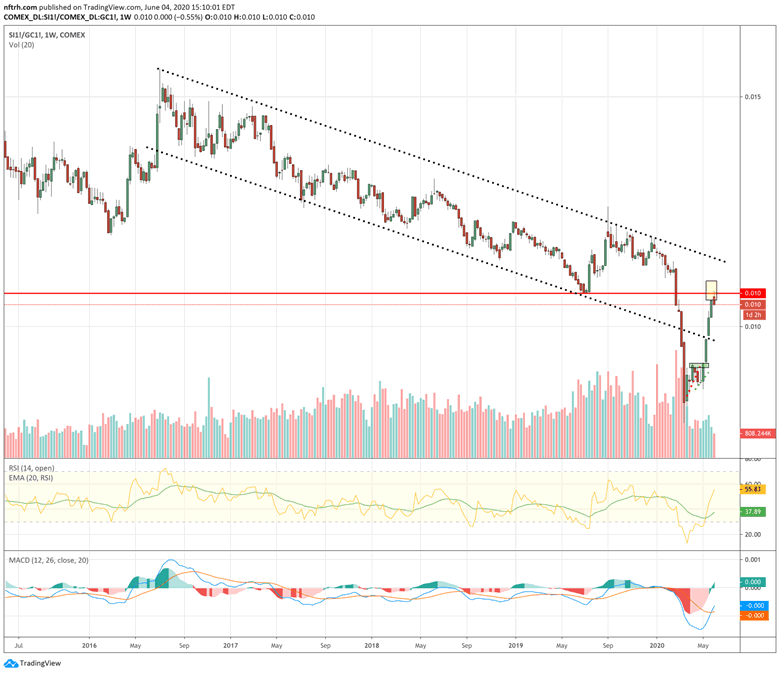
The weekly chart shows the strong rebound in this early inflation indicator within what is still a downtrend.
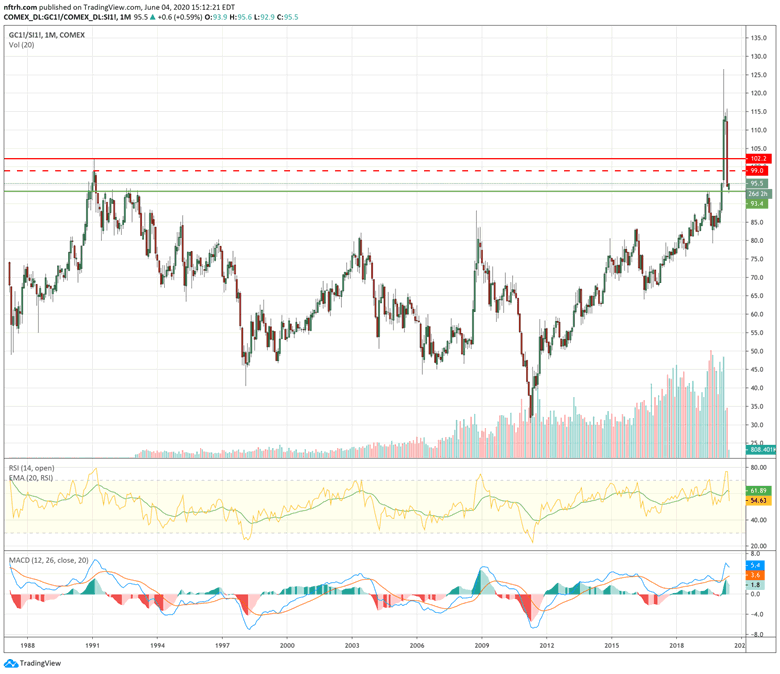
For a big picture view let’s flip it over to its evil mirror image, the Gold/Silver Ratio (GSR). If a rising SGR is an indicator of inflation and speculation a rising GSR is obviously the opposite. The big breakout in March gained a lot of attention as frightened herds sold everything that was not nailed down first and asked questions later. Taken at face value, this is still a dangerous situation because this liquidity stress indicator has not broken down on its long-term view.
If the GSR holds here the damage to the reflation trades could be extensive. They are mostly down trending after all and as such, are only indicated to be bouncing (see copper below). Optimists will say that change has to start somewhere and that somewhere would be in taking out the SGR’s yellow box on the first chart above, with silver establishing real leadership over gold. We are not there yet.
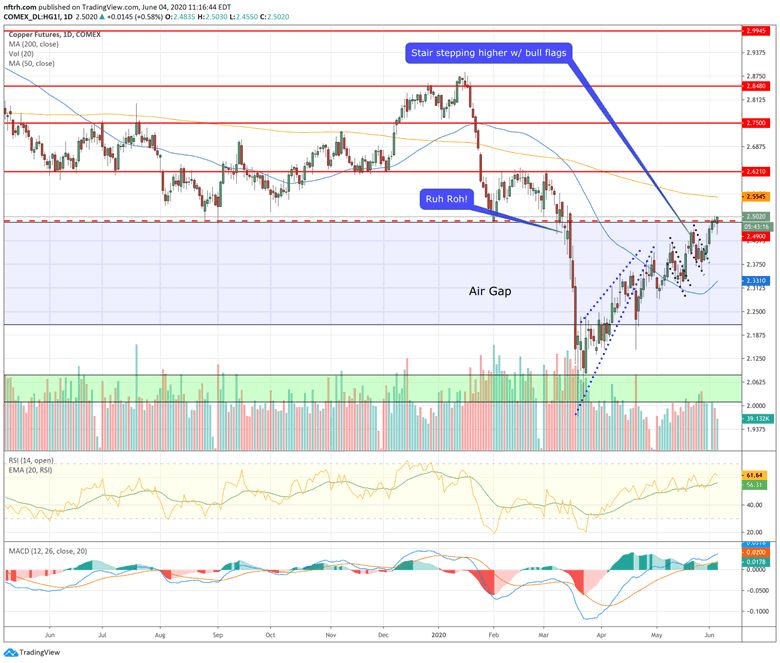
Copper has played (reflationary) ball by rising to the first real resistance zone at 2.50. The next resistance is the SMA 200 at 2.55 and after that lateral resistance at 2.62. Copper’s trends are still firmly down and risk to the metal to which many ascribe great economic importance is high.
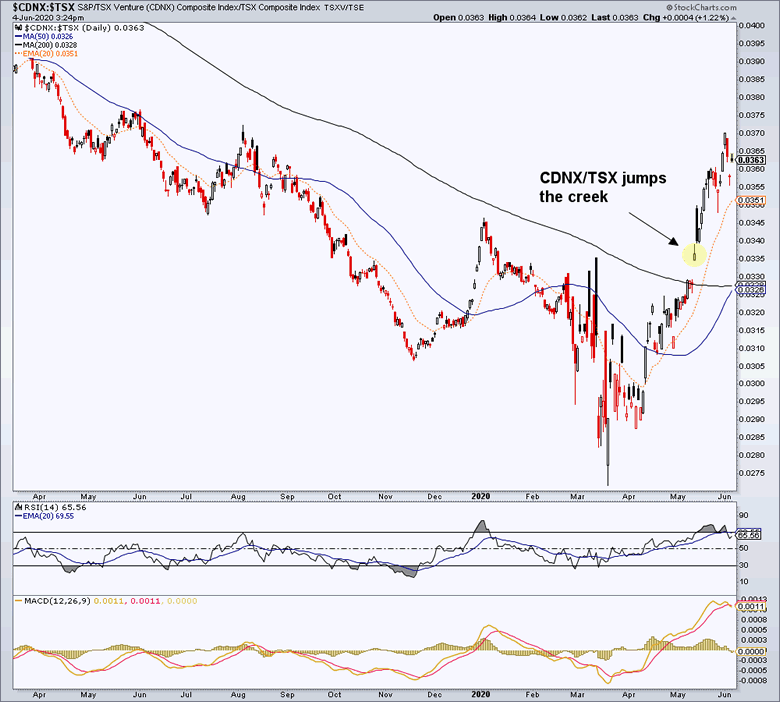
The CDNX/TSX ratio, another of our early inflation indicators, popped above the SMA 200 in early May, which we noted in real time in a subscriber update because it’s another important indicator on the future macro.
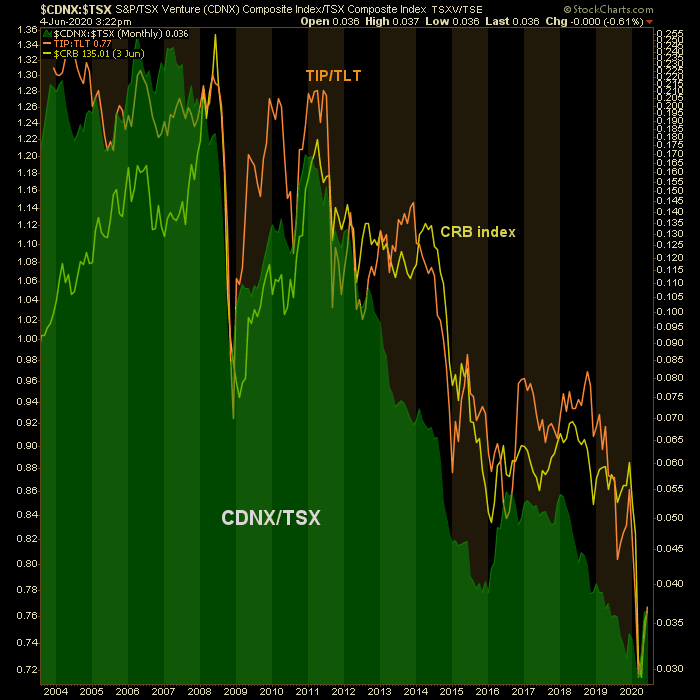
Why is it important? Don’t take my word for it. Review the fact of the ratio’s general correlation to both the CRB commodity index and the US inflation expectations gauge, TIP/TLT on this monthly log scale chart. If daily CDNX/TSX above is changing trend for real then commodities and inflation expectations should eventually follow.
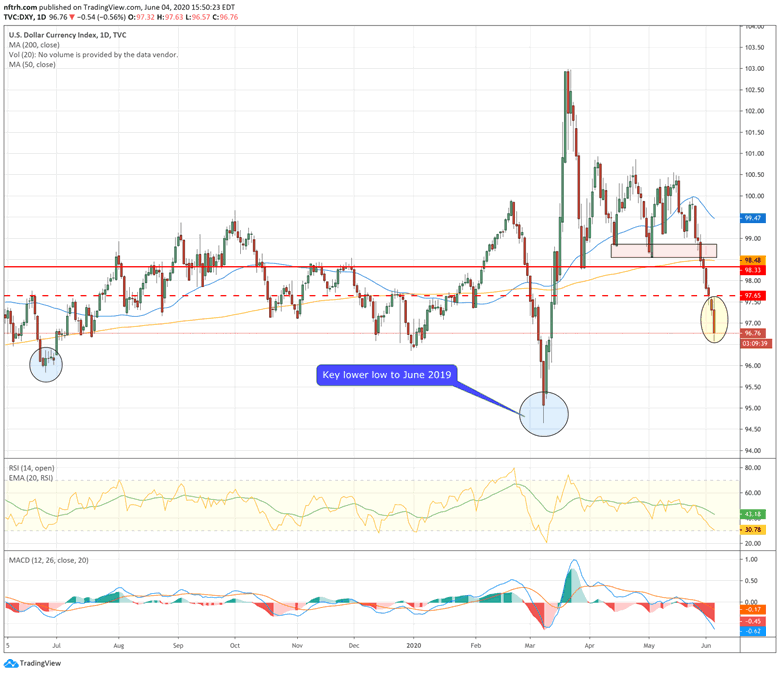
These are a few important things to be watching with respect to a reflation/inflation trade, which US and global central banks are trying their best to promote. So far, the US dollar is playing ball too and it is an important indicator in its own right. Unless this is some sort of bizarre head fake Uncle Buck has broken down and should set about the March lows.
Bottom Line
While I see reasons for caution on the short-term (e.g. SGR & Copper at initial targets within downtrends), I also see positives like the CDNX/TSX ratio very possibly changing trend and the USD breaking down.
Whether this plays out now or later on, a set it and forget it and/or diversified market orientation is not going to work well. If the picture is inflationary, you invest inflationary. If it is deflationary you invest (or hold tons of safer cash equivalents/bonds) deflationary. If it is one of the grey areas in between, well, I’ll leave that up to you.
Just two months ago the world was completely terrified of deflation and that liquidity crisis drove ’em all to cash. If the signals above go positive for real too much cash will actually be an impairment considering that the Fed is actively trying to turn the US dollar into even funnier munny than it and its trampy global counterparts already are.
What we are doing in the article above is gauging the progress of the transition to the next, and likely much different, phase. There will be stops, starts and volatility along the way. But when the time comes that the inflation/reflation indicators have changed trend you’ll know the macro is already in its new phase.
Subscribe to NFTRH Premium (monthly at USD $33.50 or a 14% discounted yearly at USD $345.00) for an in-depth weekly market report, interim market updates and NFTRH+ chart and trade setup ideas, all archived/posted at the site and delivered to your inbox.
You can also keep up to date with plenty of actionable public content at NFTRH.com by using the email form on the right sidebar and get even more by joining our free eLetter. Or follow via Twitter ;@BiiwiiNFTRH, StockTwits or RSS. Also check out the quality market writers at Biiwii.com.
By Gary Tanashian
© 2020 Copyright Gary Tanashian - All Rights Reserved
Disclaimer: The above is a matter of opinion provided for general information purposes only and is not intended as investment advice. Information and analysis above are derived from sources and utilising methods believed to be reliable, but we cannot accept responsibility for any losses you may incur as a result of this analysis. Individuals should consult with their personal financial advisors.
Gary Tanashian Archive |
© 2005-2022 http://www.MarketOracle.co.uk - The Market Oracle is a FREE Daily Financial Markets Analysis & Forecasting online publication.