


Staying Cautious & Staying Prepared With You Stocks Trading Account
Stock-Markets / Stock Markets 2020 Jun 15, 2020 - 10:44 AM GMTBy: Chris_Vermeulen

Over the past 30+ days, our researchers have been warning our friends and followers to stay cautious and to consider the risks within this market trend. Certainly, we’ve received some emails and contact from some people suggesting we should become more active, but we’ve also received many emails from members that feel we’ve kept them safely removed from the volatility and risks associated with this wild price rotation during these uncertain times. Additionally, we’ve been able to grow their accounts at the same time.
One of the reasons we’ve been able to accomplish this is because our research team identified a major supercycle event that was likely near August 2019 and continued to warn our members of this potential event well ahead of the projected event date. We also issued a Black Swan warning on February 21, 2020 warning all of our members to “get into cash” and to prepare for a very big price event.
Throughout this massive price rotation, we’ve been protected from risk by properly hedging our investments into Metals, Bonds, and other sectors all of which were profitable trades. Our goal is to attempt to find the “Best Asset Now” known as our BAN strategy to keep our traders and investor safely positioned. We try to avoid taking unwanted risks and wait for the markets to set up a proper trading trigger before executing a new trade.
In today’s article, we wanted to share a bit of longer-term research highlighting why we believe the current price rally may present some very real risk for certain traders and why we continue to be cautious in our actions. There is plenty of time to wait for the markets to setup better trade triggers – we just can’t fall into the trap of being greedy and feeling like we have to trade all the time. The reality of the markets is that more than 55% to 65% of the time we are waiting for trade setups.
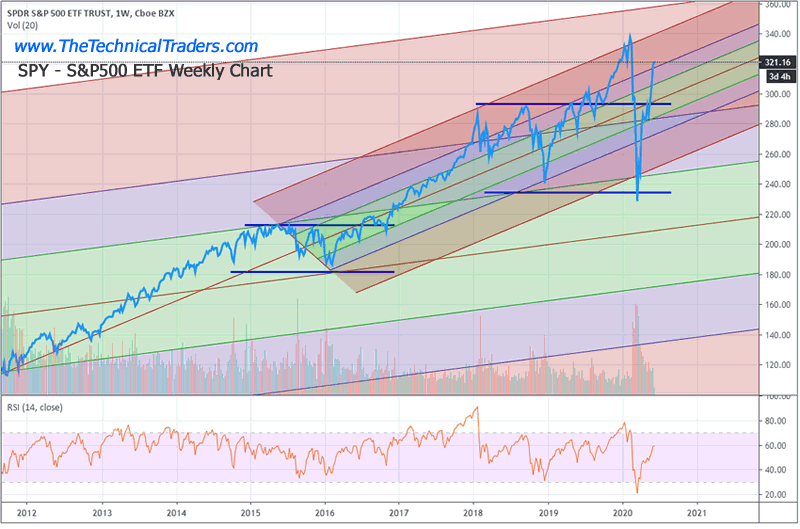
SPY – S&P500 ETF WEEKLY CHART
This first chart is the SPY Weekly chart highlighting the price channels that are currently driving many facets of the current price rotation.
The shorter-term price channel, from 2015~16 till now, is suggesting the current price has rallied back to levels near the upper 1x Std. Deviation range. This area is typically where we would expect the price to stall or set up some type of price retracement from recent peaks. Applying the strategy to a longer-term price channel, we can see the price is already well above the 1x Std. Deviation channel and nearing the 2x level. You’ll hear many people telling you this stock market rally is “forward-looking” and attempting to price in a future recovery of the US stock market and US economy.
We believe this current rally is more about speculation with the US and foreign investors piling into the US Fed based rally as the “best investment on the planet right now”.. and we believe we are starting to see signs that this rally is close to reaching a critical peak.
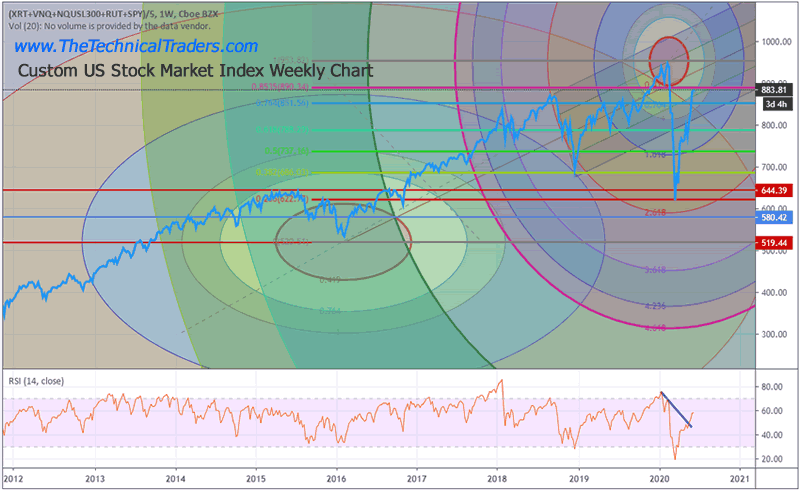
CUSTOM US STOCK MARKET INDEX WEEKLY CHART
This next chart is our Custom US Stock Market index using our Fibonacci Price Amplitude Arcs and a traditional Fibonacci Retracement. Our Price Amplitude Arcs attempt to measure Fibonacci as it related to previous price trends and attempts to identify frequency and resonance (think Nikola Tesla) in relation to past and future price target and inflection points. Currently, the Arc near the February peak is suggesting price is nearing a 0.764% Arc level – which is a fairly narrow price area near the original peak price level. These “inner” price levels don’t often come back into play after price moves dramatically away from them – in most cases. The fact that the SPY price level has recovered so quickly over time and is now targeting these inner arc levels suggests that volatility could become excessive again.
One other technical trigger our researchers want to point out is that price has reached the 0.8535% Fibonacci retracement level recently. This is not a typical Fibonacci retracement level for many people. There are important levels between 0.75% and 0.97% that are often very important when price sets up in a near Double Top or Bottom pattern. These levels become important because they often reflect a “failure level” for price.
Currently, we are still warning of excessive risks and the very strong potential for a renewed spike in volatility (VIX). But until then we do not plan to step in front of this market when it’s rising.
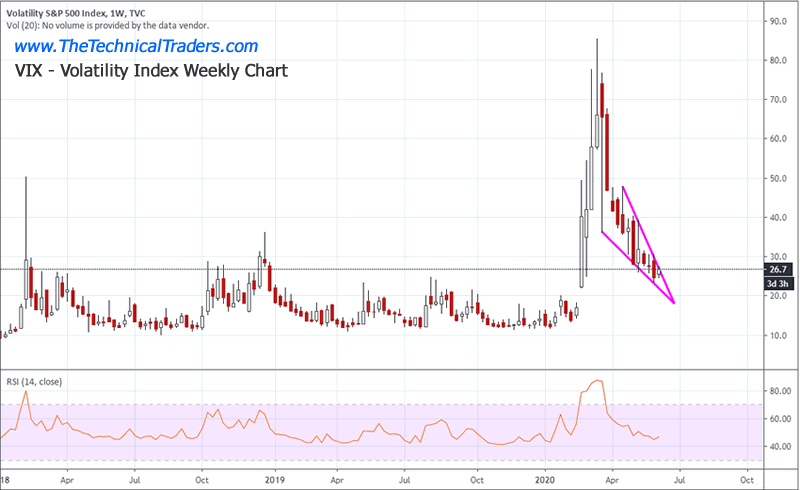
VIX – VOLATILITY INDEX WEEKLY CHART
This VIX Weekly chart highlights the Flag formation that is setting up as the US stock market rallies back towards new all-time highs. A tightening and narrowing FLAG formation is setting up in the VIX that suggests a breakout will occur fairly soon – likely with 7 to 10+ days.
Take a look at this short video we did showing what the technicals are starting to warn is coming.
Our objective is to help you navigate the risks and opportunities within the market to help you secure better and more consistent profits over time. Think of this as a longer-term battle, not a short-term race. Currently, there are a number of ETFs and market sectors that are on our radar (Utilities, Precious Metals, Miners, Consumer Staples, Technology, Biotech, and others).
Our objective is to identify the next big move and to time the trade entry so that we eliminate as much risk as possible for our members. Right now, our research team believes there is a very high degree of risk in the markets for the reasons we have illustrated above.
There is plenty of time to find and execute great trades and we don’t mind waiting for the best opportunities with our accounts sitting in cash – protected from any and all risk.
The reason for today’s article is to help you understand what our research and trading team are seeing in the markets – the potential for new volatility and new risk factors to suddenly burst into the markets. We are cautiously waiting for the markets to complete this setup and watching our trade setups for confirmation. Please consider this research article a suggestion to properly protect your open long positions and to properly hedge your portfolio accordingly. If we are right, a spike in volatility may only be about 7 to 10 days away.
As a technical analyst and trader since 1997, I have been through a few bull/bear market cycles in stocks and commodities. I believe I have a good pulse on the market and timing key turning points for investing and short-term swing traders. 2020 is an incredible year for traders and investors. Don’t miss all the incredible trends and trade setups.
Subscribers of my Investor and Swing Trading Newsletters had our trading accounts close at a new high watermark. We not only exited the equities market as it started to roll over in February, but we profited from the sell-off in a very controlled way with TLT bonds for a 20% gain, and we closed out another winning trade last Friday.
Chris Vermeulen
www.TheTechnicalTraders.com
Chris Vermeulen has been involved in the markets since 1997 and is the founder of Technical Traders Ltd. He is an internationally recognized technical analyst, trader, and is the author of the book: 7 Steps to Win With Logic
Through years of research, trading and helping individual traders around the world. He learned that many traders have great trading ideas, but they lack one thing, they struggle to execute trades in a systematic way for consistent results. Chris helps educate traders with a three-hour video course that can change your trading results for the better.
His mission is to help his clients boost their trading performance while reducing market exposure and portfolio volatility.
He is a regular speaker on HoweStreet.com, and the FinancialSurvivorNetwork radio shows. Chris was also featured on the cover of AmalgaTrader Magazine, and contributes articles to several leading financial hubs like MarketOracle.co.uk
Disclaimer: Nothing in this report should be construed as a solicitation to buy or sell any securities mentioned. Technical Traders Ltd., its owners and the author of this report are not registered broker-dealers or financial advisors. Before investing in any securities, you should consult with your financial advisor and a registered broker-dealer. Never make an investment based solely on what you read in an online or printed report, including this report, especially if the investment involves a small, thinly-traded company that isn’t well known. Technical Traders Ltd. and the author of this report has been paid by Cardiff Energy Corp. In addition, the author owns shares of Cardiff Energy Corp. and would also benefit from volume and price appreciation of its stock. The information provided here within should not be construed as a financial analysis but rather as an advertisement. The author’s views and opinions regarding the companies featured in reports are his own views and are based on information that he has researched independently and has received, which the author assumes to be reliable. Technical Traders Ltd. and the author of this report do not guarantee the accuracy, completeness, or usefulness of any content of this report, nor its fitness for any particular purpose. Lastly, the author does not guarantee that any of the companies mentioned in the reports will perform as expected, and any comparisons made to other companies may not be valid or come into effect.
Chris Vermeulen Archive |
© 2005-2022 http://www.MarketOracle.co.uk - The Market Oracle is a FREE Daily Financial Markets Analysis & Forecasting online publication.