


Stock Market Decline Resumes
Stock-Markets / Stock Markets 2020 Jun 22, 2020 - 05:07 PM GMTBy: Andre_Gratian

Current Position of the Market
SPX: Long-term trend – Having rallied well past a .618 retracement of the decline into March 2020, it is time to consider the possibility that the retracement was only an interruption of the bull market which originated in 2009.
Intermediate trend – Down into mid-July
Analysis of the short-term trend is done daily with the help of hourly charts. It is an important adjunct to the analysis of daily and weekly charts which discusses the course of longer market trends.
Daily market analysis of the short-term trend is reserved for subscribers. If you would like to sign up for a FREE 4-week trial period of daily comments, please go to www.marketurningpoints.com and request a trial.
Decline Resumes
Important Cycles
Did the 4.5-year cycle bottom in March instead of waiting for its ideal low point in July? This is a possibility according to a Hurst analyst. Perhaps we should not be too eager to call for an early low in the 4.5-year cycle. Of course, the 40-wk cycle is also due in mid-July, and it’s not exactly a wimp! Before that, a 36-day cycle is due to bottom. All the above are posted on the daily chart.
Point & Figure Overview of SPX
Intermediate projection: Loose projection for mid-July: 2586.
Market Analysis (Charts courtesy of QChart)
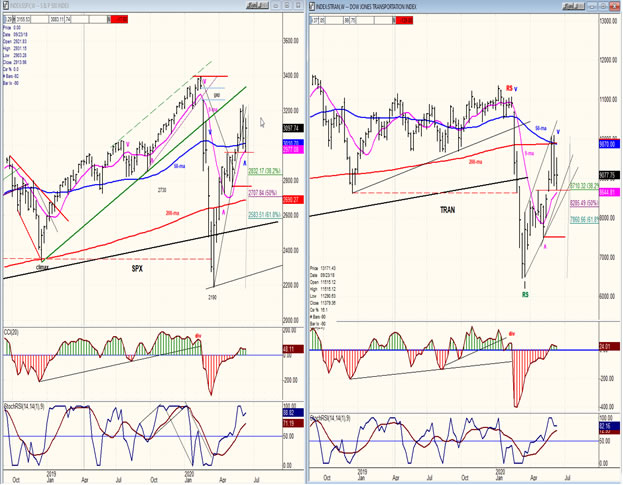
SPX-TRAN weekly charts
I have replaced IWM with TRN. The latter gives us a slight edge over IWM in predicting the end of a move by topping or bottoming ahead of SPX. This is demonstrated on the charts below when TRAN alerted us to a turn in the market direction both at the February top and March low. At times, there is no obvious warning on the weekly chart, but it is clear on the daily chart, as is the case at the current high. It is also clear that long-term relative weakness is retained by TRAN.
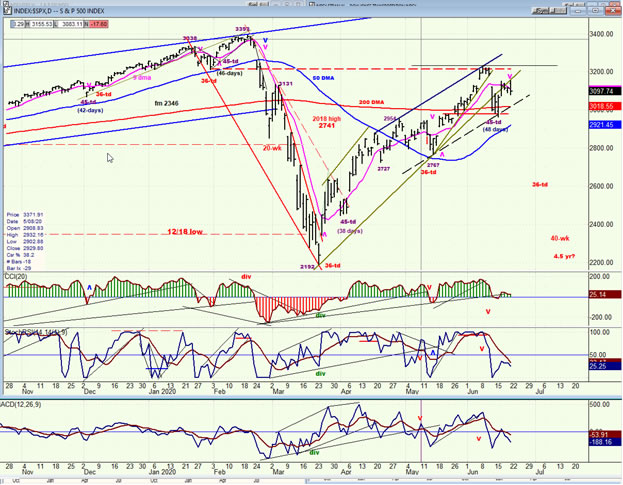
SPX daily chart
The rally which started a week ago, lasted only two days before a three-day consolidation started. On Friday, there was a move back to the top of the range which made a fractional new high, but prices began to retrace immediately, and the index ended the day near its low.
This looks as if heavy selling was met at the top of the range and it should be a prelude to additional selling over the near-term, especially since the futures sold off sharply after the close. In other words, a secondary high has been made since 3233 and the cycles shown on the chart are beginning to pull prices lower into the intermediate low which is expected in the middle of July.
That being said, we will still need final confirmation from the oscillators which were already two thirds in a selling mode but needed the CCI to go negative in order to complete a sell signal. If Friday’s action was analyzed correctly, this should happen after Monday’s session.
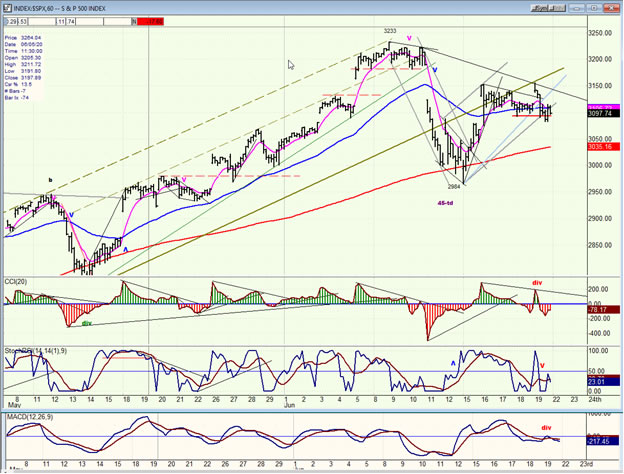
SPX hourly chart
The Green heavy trend line starts at the March low and represents the extent of the move from that level, until a reversal was made at 3233. After breaking the trend line prices found support on the 200-hr MA and rebounded. The trend line was re-tested with some minor congestion occurring around it before a little pull-back. On Friday, a final attempt was made to get back above it, and when that failed, more selling started immediately which took the index to a slightly lower correction low, with prices bouncing in the final hour but ending with a closing low for the entire consolidation which now has the appearance of a top that is ready to give way to the next leg of the correction which started from 3233.
On Thursday, a sell signal was generated by the oscillators, and Friday’s action was the final attempt at holding off the next selling wave which, judging by the action of the futures after the close, is now underway.
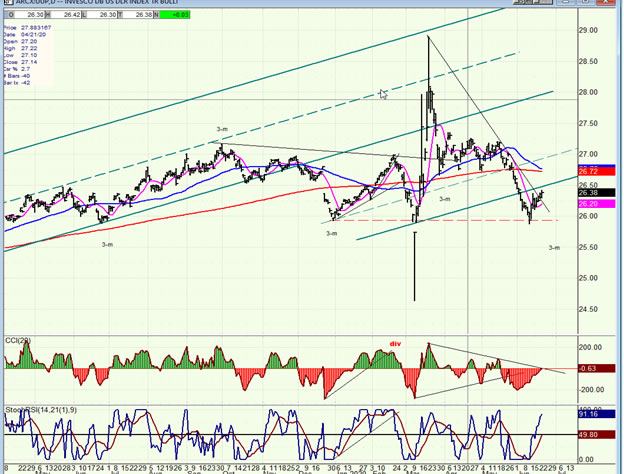
UUP (dollar ETF) daily
UUP found support at a former holding level and has rallied from a near-term oversold condition. Unless its 3-mo cycle has made an early low, it should resume its downtrend, perhaps after retesting the resistance at the green parallel line directly above.
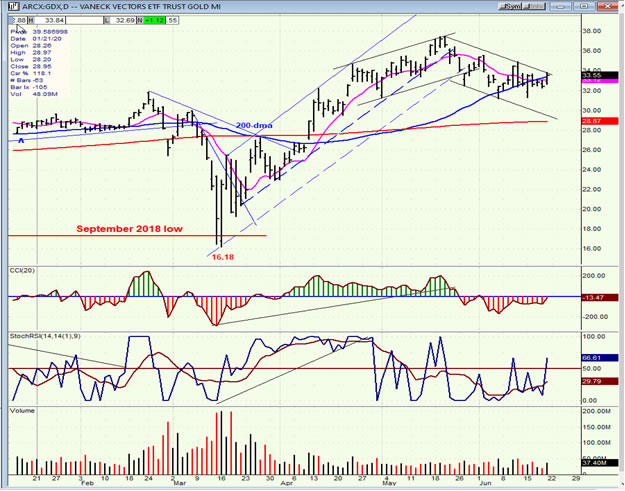
GDX (Gold miners ETF) daily
GDX may be ready to pull back into a short-term cycle which ranges from 6 to 8 trading days, and eventually conclude its correction at about 30.
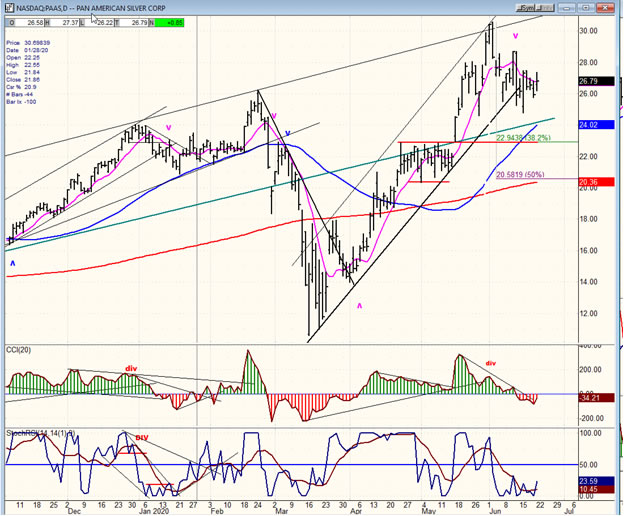
PAAS (Pan American Silver Corp.) daily
Like GDX, PAAS is also correcting and should continue its downtrend until it reaches a .382 retracement of its current uptrend at 22.95. That coincides with a good support level.
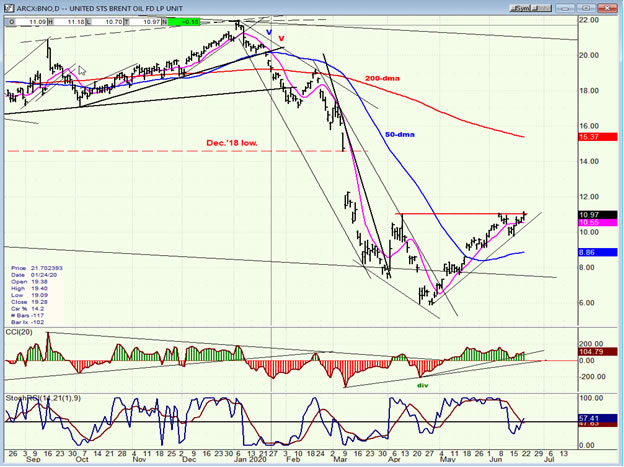
BNO (U.S. Brent oil fund) daily
BNO has bounced to retest its resistance level but has not surpassed it. It is likely that the resistance will hold, especially if the market continues to correct.
Summary
SPX appears to have concluded a secondary high on Friday. If so, this would be the start of the next downtrend phase from the 3233 high, with the entire correction not likely to find an intermediate low until mid-July.Andre
FREE TRIAL SUBSCRIPTON
For a FREE 4-week trial, send an email to anvi1962@cableone.net, or go to www.marketurningpoints.com and click on "subscribe". There, you will also find subscription options, payment plans, weekly newsletters, and general information. By clicking on "Free Newsletter" you can get a preview of the latest newsletter which is normally posted on Sunday afternoon (unless it happens to be a 3-day weekend, in which case it could be posted on Monday).
Disclaimer - The above comments about the financial markets are based purely on what I consider to be sound technical analysis principles uncompromised by fundamental considerations. They represent my own opinion and are not meant to be construed as trading or investment advice, but are offered as an analytical point of view which might be of interest to those who follow stock market cycles and technical analysis.
Andre Gratian Archive |
© 2005-2022 http://www.MarketOracle.co.uk - The Market Oracle is a FREE Daily Financial Markets Analysis & Forecasting online publication.