Following the Gold Stock Leaders as the Fed Prints
Commodities / Gold and Silver Stocks 2020 Jul 09, 2020 - 01:27 PM GMTBy: Gary_Tanashian
Gold stocks have led the market for a year, and with economic deceleration and Fed policy response that leadership looks to continue [edit: today’s ‘in the bag’ bounce-back Jobs report does little to alter the economic deceleration theme]
We have been on a bullish gold mining view for over a year now. Over that time there have been three interruptions, the downward-biased consolidation from August to November 2019, the flash crash (and very constructive gap filling mission) in March and most recently the pullback that logically began in May as broad stock market relief started to fan out to more and more momentum chasers who’d finally gotten the hint that the Fed means to devalue the US currency (in competition to a degree with its global counterparts seeking to do the same), making cash a non-viable investment position (other than for risk management to the bullish asset market atmosphere).
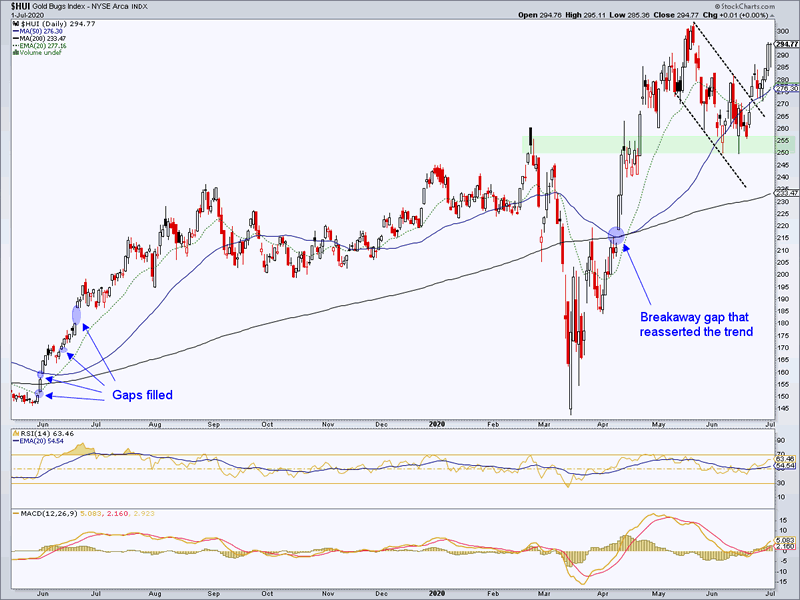
The daily chart of HUI shows a successful support test, purely up trending moving averages, all gaps filled but the breakaway gap (a ‘breakaway’ does not need to fill any time soon as it changes or reasserts a trend; there is also an old gap from 2016 near 100 that we need not worry at this time), RSI now positive and trending up above its EMA 20, MACD triggered up and positive and neither of them showing overbought readings. Ah, the beauty of a routine correction within an uptrend. All systems on this daily chart are technically ‘go’.

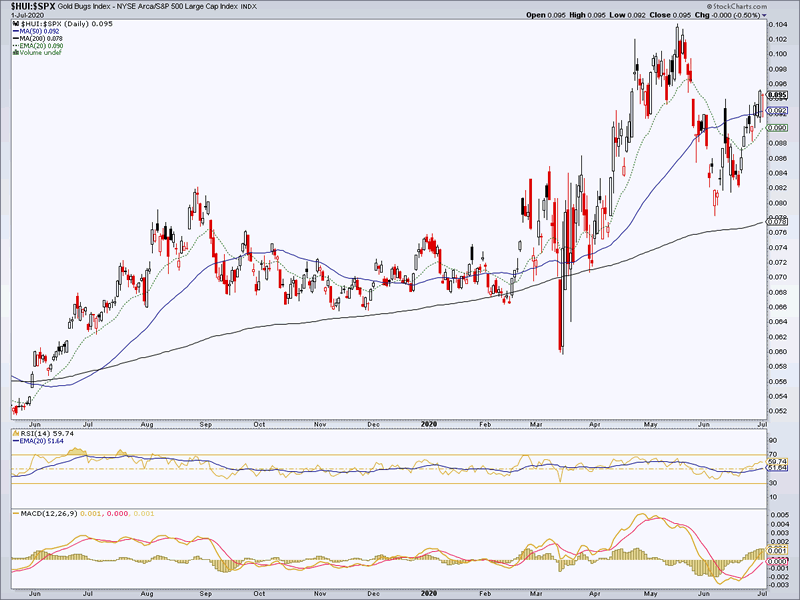
What’s more, the HUI/SPX ratio is now on an uninterrupted 1-year uptrend. With the come-lately players (institutions, hedge funds, black boxes, Ma ‘n Pa and knee-jerking herds of all stripes) having moved on to perceived greener pastures due to the broad stock market’s May-June out performance the gold miners are again taking leadership.

It’s as it should be. The macro backdrop – including panicked money printing, bond market manipulation and other components of MMT or more accurately, TMM (see below) – sees the Fed cheapening money units in favor of asset prices. Same old trick, different crisis.
The TMM is inflicted to rescue (through continued and intensified financialization of the economy) what was an already wavering economy before COVID-19 and has been an intensely decelerating economy since (interrupted by joyous bursts of relief on the inevitable bounce-backs in economic indicators from unsustainable depths).
From the June 19th post Gold Sector Correction is Maturing:
But here I’ll repeat that the Fed is balls out printing money (really funny munny), manipulating Treasury and Corporate bonds and stating that it will have virtually no limits in this MMT (I would turn around MMT to call it what it actually is, TMM or Total Market Manipulation). They can give it a fancy name like Modern Monetary Theory but by any other name it is chicanery and a scam that society will suffer the fallout from some day.
They are cheapening the munny units in order to give the appearance of rising asset (especially stock asset) units. Say it again… “they are cheapening the munny units in order to give the appearance of rising asset units.”
Hence, gold. The shiny rock, the bullion, the anchor to monetary sanity. In this surreal monetary realm it is something real.
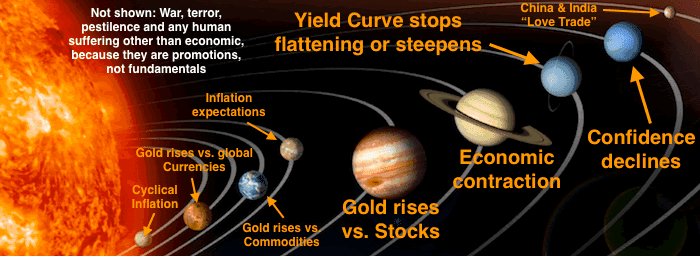
Early on, before the gold stock sector had established its nominal and relative (to SPX) up trends, we used the Macrocosm * as our guide to the proper investment backdrop for the gold sector and this has worked perfectly. Now with the technical trends in place it’s all systems ‘go’ from that vantage point as well.

As long as gold and especially the miners continue to out perform broad stocks the indication is that we are early in the bull phase. We are still in the transition period from economic destruction to destructive inflationary response by policy makers. If that response succeeds and produces a cyclical inflation ** the gold sector will fade to the status of just another asset market to trade before it ultimately crashes again some day. But if the inflationary policy response does not succeed in producing much more than stagflation or worse, does not forestall deflation, the gold sector will remain fundamentally front and center.
Backing away from the macro now, the long-standing NFTRH target (initial, not ultimate) for HUI is 375, which was derived from a big picture monthly chart first (in 2019), and then in April by a daily chart from a completely different vantage point (got to love it when different vantage points are in confluence).
With the likely end of the most recent correction, the macro backdrop in place and just as importantly the technical trends in place, the mode has been to increase exposure to the best miners, explorers and royalties out there. We update a bunch of charts each week (28 of them in NFTRH 609) and even did a timely update (still password protected) showing the more ‘buy-able’ charts on June 30.
Yet NFTRH is not just a gold stock rag. There is a world full of assets out there and we’ve been keeping updated strategies in tune every step of the way out of the COVID-crash. With the gold stocks as a firm leader, the future is on track to add new wrinkles to current investment themes.
* If it takes a cartoon like the Macrocosm to differentiate a truly positive macro-fundamental backdrop from that imagined by too many inflationist bugs, then so be it.
** By “cyclical inflation” I mean inflationary economic growth, as per the 2003-2007 period.
Subscribe to NFTRH Premium (monthly at USD $33.50 or a 14% discounted yearly at USD $345.00) for an in-depth weekly market report, interim market updates and NFTRH+ chart and trade setup ideas, all archived/posted at the site and delivered to your inbox.
You can also keep up to date with plenty of actionable public content at NFTRH.com by using the email form on the right sidebar and get even more by joining our free eLetter. Or follow via Twitter ;@BiiwiiNFTRH, StockTwits or RSS. Also check out the quality market writers at Biiwii.com.
By Gary Tanashian
© 2020 Copyright Gary Tanashian - All Rights Reserved
Disclaimer: The above is a matter of opinion provided for general information purposes only and is not intended as investment advice. Information and analysis above are derived from sources and utilising methods believed to be reliable, but we cannot accept responsibility for any losses you may incur as a result of this analysis. Individuals should consult with their personal financial advisors.
Gary Tanashian Archive |
© 2005-2022 http://www.MarketOracle.co.uk - The Market Oracle is a FREE Daily Financial Markets Analysis & Forecasting online publication.


