


Gold and gold mining stocks are entering a strong seasonal phase
Commodities / Gold & Silver 2020 Jul 21, 2020 - 12:49 PM GMTBy: Dimitri_Speck

You may have heard that gold typically rallies seasonally from the middle of the year. This trend is driven by jewelry demand, which increases ahead of the Christmas business, the Indian wedding season and the Chinese New Year celebrations on the back of advance purchases by jewelers, which tend to put upward pressure on prices.
But what about the seasonal trend in gold stocks? Since the earnings of gold producers are highly geared to the gold price, a relationship should be discernible.
Gold seasonality under the magnifying glass
First let us take a look at the seasonal chart of gold. Contrary to a standard price chart, the seasonal chart shows the price pattern of gold in the course of a calendar year averaged over numerous years. In this case, the average of the past 24 years was calculated. The horizontal axis shows the time of the year, the vertical axis depicts price information (indexed to 100).
Gold priced in USD, seasonal pattern over the past 24 years
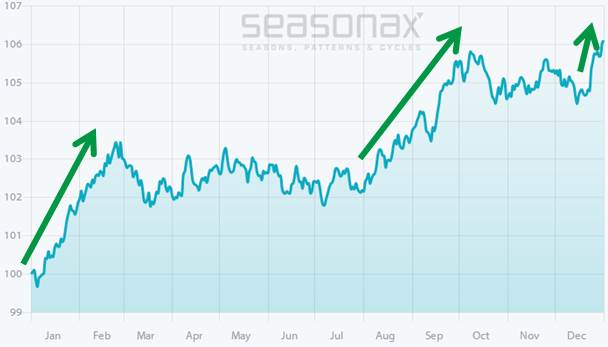
The gold price tends to rise from the middle of the year.
Source: Seasonax
As the chart illustrates, there is an interim seasonal low on July 07, which marks the formal beginning of the seasonally strong phase in gold. Briefly interrupted by a somewhat weaker phase from mid-October to mid-December, it ends on 24 February of the following year. By contrast, the gold price tends to lose ground from the end of February to the beginning of July.
I have highlighted the two strongest seasonal advances with arrows. One advance lasts from the end of July to the beginning of October (arrow in the middle of the chart) - and this favorable seasonal trend for gold begins quite soon!
The other one lasts from mid-December (small arrow to the right of the chart) to the end of February of the following year (arrow to the left of the chart).
Comparison with the seasonality of gold mining stocks
You may be wondering why I have specifically chosen a 24-year seasonal chart of gold. The reason is that the gold mining index HUI (NYSE Arca Gold Bugs Index) begins in 1996. This start date therefore enables the longest possible comparison between the seasonal trends of gold and the gold stock index.
Let us examine the next chart to this end, which compares the seasonal patterns of gold and gold mining shares. The blue area once again shows the 24-year seasonal pattern of the gold price (note: the vertical scale differs from that of the previous chart). The red line depicts the seasonal pattern of the HUI gold stock index.
Gold priced in USD (blue), HUI gold stock index (red), seasonal patterns over the past 24 years
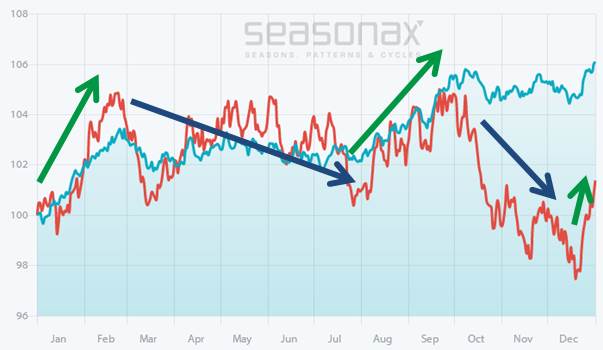
A firm gold season underpins gold mining stocks as well!
Source: Seasonax
First consider the two favorable phases. The currently beginning phase from the end of July to the beginning of October is also reflected in the red line depicting the seasonal pattern of gold stocks - their prices are rising as well (arrow in the middle of the chart).
The same applies to the phase from mid-December (small arrow to the right of the chart) to the end of February of the following year (arrow to the left of the chart). Like gold itself, gold stocks are also seasonally strong in this time period.
A trend reversal takes hold in phases which are problematic for gold as well. During the lengthy time period from the end of February to the beginning of July, in which gold is seasonally somewhat weaker, the gold mining index declines as well (blue arrow to the left).
The short phase from mid-October to mid-December is a particularly difficult time for gold stocks. Gold barely weakens seasonally, but the mining stocks tend to post significant losses. This is primarily attributable to persistent weakness in gold mining stocks in the late 1990s.
Fundamental drivers are responsible for the seasonal patterns in gold mining stocks and other equities!
As can be seen above, a strong seasonal phase for gold exerts favorable effects on the trend of gold stock prices as well. Rising gold prices spur the imagination of investors regarding gold mining sector earnings. However, absent these hopes about earnings prospects, gold stock prices at times suffer significant seasonal declines.
There can be many reasons for individual seasonal patterns in share prices. Today it was demonstrated how the strong seasonal phase of the produced raw material gold affects the seasonal price trend of the stocks of gold producers.
Naturally, company-specific drivers that have a seasonally positive effect on earnings expectations and hence share prices also exist in other industries. These may include trade fairs, which are regularly followed by an increase in new orders, or in the case of agricultural companies, large sales volumes ahead of the planting season – and much more. Thus there exist a great many more seasonal patterns in individual stock prices.
If you want to take advantage of the precise seasonal patterns of individual gold mining shares or other equities and/or other commodities, I recommend visiting www.seasonax.com!
Yours sincerely,
Dimitri Speck
Founder of Seasonax and Head Analyst 90 Tage Trader
PS: With the Seasonax event tool you can create your own event studies!
© 2020 Copyright Dimitri Speck - All Rights Reserved - Disclaimer: The above is a matter of opinion provided for general information purposes only and is not intended as investment advice. Information and analysis above are derived from sources and utilising methods believed to be reliable, but we cannot accept responsibility for any losses you may incur as a result of this analysis. Individuals should consult with their personal financial advisors.
© 2005-2022 http://www.MarketOracle.co.uk - The Market Oracle is a FREE Daily Financial Markets Analysis & Forecasting online publication.