


Stock Market Technical Patterns, Future Expectations and More
Stock-Markets / Stock Markets 2020 Jul 30, 2020 - 06:24 PM GMTBy: Chris_Vermeulen

We get a lot of questions from individuals every week. Our research posts contain a lot of varied examples of Technical Analysis, Economic Data Points, Advanced Price Theory, and other more obscure analysis techniques. Yet, sometimes our readers want to know more – how do we read the tea leaves to try to adopt a consensus approach to trading, investing, and hedging the global markets at times like these?
The easiest answer is that we are a team of technical researchers and analysts. Every day we are watching our proprietary modeling systems, various market symbols, and technical/price setups that occur throughout the globe. Because we specialize in US stocks, ETFs, and Futures, our concern is how the US market will react to these impulses. Having said that, we explore ideas about how capital will flow from one asset class to another over time as various rotations in the global market take place.
Every week, we communicate different points of view and do so across different time frames which provides you with a full view of long and short term expectations and potential moves for stocks and commodities.
Sometimes this can be confusing to follow if you don’t understand the time horizon we are discussing. One article may be about a major double top in the stock market with long term bearish implications, and the next article about more upside potential in stocks as the stock market tries to fill the February price gap window. One is bearish, the other is bullish, both provide a ton of insight for a different type of trader and time horizon looking forward.
The team is able to explore and identify any potential trade setup/trigger we believe is important for our future success. Our team can identify short, intermediate, or longer-term setups in any symbol or market segment. We then discuss the potential for each setup/trigger and attempt to validate the setup/trigger using our proprietary technology. We focus on confirmed trade setups originating from a variety of proprietary technology solutions that are aligned with our researcher’s general analysis.
This keeps our team honed in on what is really happening in the markets as we attempt to identify the “Best Asset Now” related to potential risk and profit. The one thing that many people don’t understand is how much we discuss “RISK”. The first thing any of our researchers accomplish before they suggest a trade setup is a “Risk Analysis” related to the price structure and future expectations. Our researchers may think a certain symbol or asset class is the greatest trade of the year, but risk factors associated with general market conditions, recent support/resistance levels, or volatility may disqualify that trade simply because we won’t allow anything to take excessive risks for our members. Our view is “there will always be another trade setting up in the next two or three days”.
Before you continue, we suggest taking a moment to read some of our other “bigger picture” research posts on silver, gold, and the US markets. Be sure to opt-in to our free market trend signals before closing this page so you don’t miss our next special report!
MARKET PERSPECTIVES
We are sharing some of our most recent research with all of you to help you understand how we view different market perspectives and opportunities as triggers set up in the US stock market. We view some of these longer-term triggers as “bigger waves” that are setting up out in the ocean. When they hit the shore, they have the potential of disrupting things quite extensively and causing quite a bit of damage. But until they hit the shoreline, they are just big waves that are pending in the future.
Our shorter-term systems help us navigate the smaller price rotations and are often what we fall back onto to confirm trade triggers. If the bigger wave suggest greater risk is a factor, then we’ll adjust the targets and stops for our shorter-term triggers to help eliminate risk and turn the short-term trades into a “scalping-type” of trade. Quick in and out for 5% to 7% (or more) and then wait for the next setup.
In a broader sense, we are simply navigating the seas and tides while attempting to identify the best opportunities for our members. We write about all types of technical and price pattern triggers – even economic data. Internally, we focus on technical patterns and setups that are generated by our proprietary trading/modeling systems. So, when you read any of our public research posts, remember that internally we may be viewing things quite differently as the technical and modeling systems are only deployed for subscribers or members.
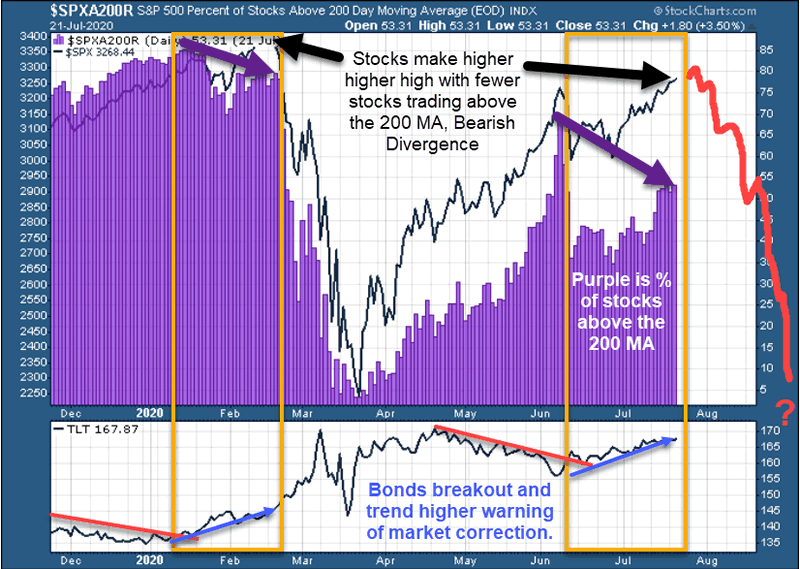
MIRRORED 200 DAY MA SETUP
This first example highlights what we believe is a very clear longer-term setup relating to the general market weakness across a broad segment of the US stock market. Back in February 2020, a similar type of pattern set up just before the February 24 collapse. Now, we have a bigger and broader divergence between the number of stocks above their 200 Day Moving Average levels while Bonds (TLT) is climbing higher. This, generally, warns that the markets are stalling and may settle into a downside price trend.
Could the downside price trend be aggressive and volatile? You bet it could. But right now we know this “big wave” is pending and we also know that risks seem rather high for a downside price correction given this technical pattern setup.
BEARISH DIVERGENCE
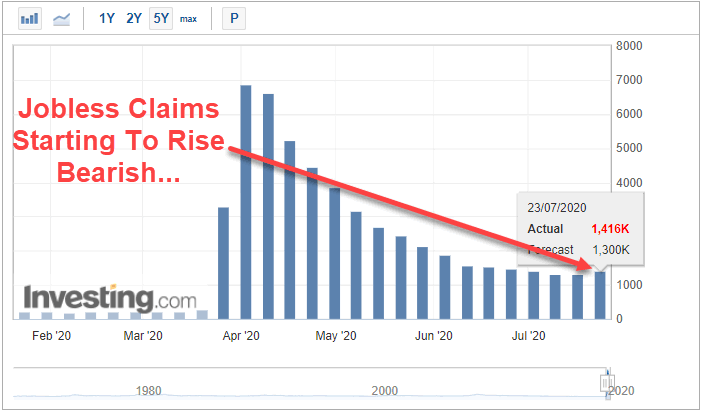
This second chart highlights the Jobless Claims levels over the past 6+ months of 2020. The one thing we want to highlight is the moderate increase in the latest Jobless Claims level and how that may represent a “second wave” of COVID-19 cases prompting additional closures/shut-downs within the US economy in some states. The last thing this recovery effort needs right now is another wave of newly unemployed workers and this data could become a very real problem when you consider the spending, housing, mortgage, credit card, and other factors that are associated with “a loss of income” for any active consumer. There is a domino-process that is likely to take place if these workers are unable to find new jobs quickly.
JOBLESS CLAIMS STARTING TO RISE AGAIN…
Now, as we close out this first part of our Technical Patterns, Trading Perceptions, Future Expectations, and More research post, we want to ask you if you would do anything differently than we currently do to attempt to effectively trade and manage risk levels throughout these incredible times and price swings in the global markets? Remember, we actually called these incredible price moves back in July/August 2019 (and earlier) with our Super-cycle research and other longer-term cycle analysis:
July 24, 2019: THE BLACK HOLE IN GLOBAL BANKING IS BEING EXPOSED
August 14, 2019: GLOBAL CENTRAL BANKS MOVE TO KEEP THE PARTY ROLLING
August 28, 2019: PRECIOUS METALS ABOUT TO PULL A CRAZY IVAN
Over the past 12 months, we’ve effectively called many of the biggest market moves and trends – in some cases many months in advance. Our predictions related to precious metals have been highlighted on many other podcasts and segments. We consider it an honor to be included in other’s interpretations and presentations – yet we also know the accuracy of our research is what really counts.
This brings us back to the start of this post – our efforts in generating these free research posts is to help you understand what we are thinking along different time horizons to help you develop your own consensus outcome. We hope you are gaining real value from our efforts because we are not going to stop now – this is when you need us the most. 2020 through 2024 are going to include some of the biggest price swings we’ve seen in decades.
Get our Active ETF Swing Trade Signals or if you have any type of retirement account and are looking for signals when to own equities, bonds, or cash, be sure to become a member of my Passive Long-Term ETF Investing Signals which we are about to issue a new signal for subscribers.
Chris Vermeulen
www.TheTechnicalTraders.com
Chris Vermeulen has been involved in the markets since 1997 and is the founder of Technical Traders Ltd. He is an internationally recognized technical analyst, trader, and is the author of the book: 7 Steps to Win With Logic
Through years of research, trading and helping individual traders around the world. He learned that many traders have great trading ideas, but they lack one thing, they struggle to execute trades in a systematic way for consistent results. Chris helps educate traders with a three-hour video course that can change your trading results for the better.
His mission is to help his clients boost their trading performance while reducing market exposure and portfolio volatility.
He is a regular speaker on HoweStreet.com, and the FinancialSurvivorNetwork radio shows. Chris was also featured on the cover of AmalgaTrader Magazine, and contributes articles to several leading financial hubs like MarketOracle.co.uk
Disclaimer: Nothing in this report should be construed as a solicitation to buy or sell any securities mentioned. Technical Traders Ltd., its owners and the author of this report are not registered broker-dealers or financial advisors. Before investing in any securities, you should consult with your financial advisor and a registered broker-dealer. Never make an investment based solely on what you read in an online or printed report, including this report, especially if the investment involves a small, thinly-traded company that isn’t well known. Technical Traders Ltd. and the author of this report has been paid by Cardiff Energy Corp. In addition, the author owns shares of Cardiff Energy Corp. and would also benefit from volume and price appreciation of its stock. The information provided here within should not be construed as a financial analysis but rather as an advertisement. The author’s views and opinions regarding the companies featured in reports are his own views and are based on information that he has researched independently and has received, which the author assumes to be reliable. Technical Traders Ltd. and the author of this report do not guarantee the accuracy, completeness, or usefulness of any content of this report, nor its fitness for any particular purpose. Lastly, the author does not guarantee that any of the companies mentioned in the reports will perform as expected, and any comparisons made to other companies may not be valid or come into effect.
Chris Vermeulen Archive |
© 2005-2022 http://www.MarketOracle.co.uk - The Market Oracle is a FREE Daily Financial Markets Analysis & Forecasting online publication.