


Precious Metals Warn Of Increased Volatility Ahead
Commodities / Gold & Silver 2020 Aug 02, 2020 - 06:39 PM GMTBy: Chris_Vermeulen

Our trading team witnessed a big drop in Platinum and Palladium prices early this morning while Gold and Silver continued to push moderately higher. We began to question this move and investigate any historical relevance to previous patterns. Our research team pointed out that both Platinum and Palladium rolled lower just 3 to 4 days before the breakdown in the US stock markets on February 24, 2020, while Gold and Silver were reaching recent price peaks. Could the patterns in precious metals be a warning of another potential volatility spike and price decline in the near future?
ARE METALS PATTERNS PREDICTING A BIG DOWNSIDE PRICE EVENT?
Our research team created the charts below to help highlight the pattern that we are seeing in Precious Metals right now. First, we highlighted February 24, 2020, with a light blue vertical line to more clearly illustrate where the markets initiated the COVID-19 breakdown event. Next, we drew shaded rectangles around new downside price rotation levels that took place near this peak in the US stock markets. Lastly, we drew a red line that highlights the subsequent price decline that took place in Precious Metals as the markets tanked in late February and early March 2020.
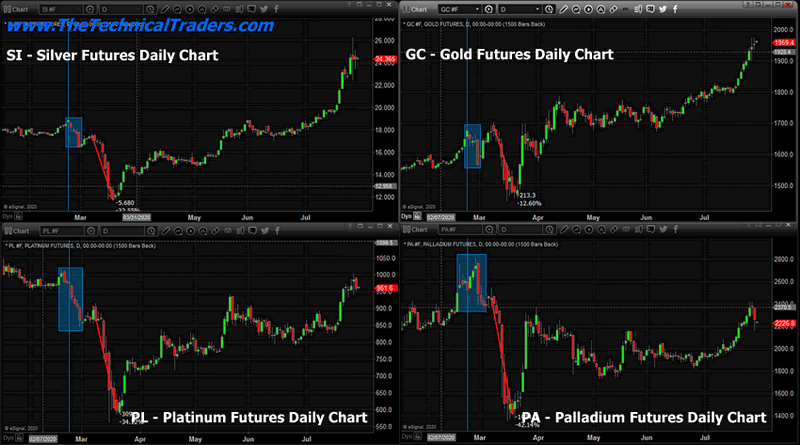
The current downside price move in Platinum and Palladium are very interesting because it appears Platinum and Palladium both initiated a downside/contraction price event just 3 to 4 days before Gold and Silver, as well as the rest of the US stock market, began to collapse on February 25, 2020. You can clearly see in the bottom two charts that Platinum and Palladium initiated a downside price correction a few days before both Gold and Silver reached their peak levels and began to move lower. Once this peak rotation took place, all four of the major metals groups moved moderately lower for about 7 days before pausing, then collapsed even further.
Our researchers believe the current setup in Platinum and Palladium may be mirroring the February 2020 peak rotation and warning that a massive volatility event and downside price contraction event may be setting up and just days away from initiating.
The breakdown in Precious Metals at a time when the US stock market is crashing is usually a result of margin calls – where traders experience losses in their trading accounts and much liquidate Precious Metals positions to cover these losses. This time, the downside event in Precious Metals may not be as deep or exaggerated as the February/March collapse. Skilled traders have already positioned their accounts to avoid margin calls. Only the novice traders may be in a position to experience this type of event in the near future.
HOW DEEP WILL IT GO?
Our researchers believe any future downside event in precious metals will likely stall near the recent support levels on these charts and immediately rotate back into a bullish trend because fear and greed won’t allow metals to fall too far before greedy traders try to scoop up these positions at discounted price levels. Our Support levels for the four Precious Metals shown are:
Silver: $19 to $21 Gold: $1780 to $1820 Platinum: $750 to $850 Palladium: $1915 to $2090
We believe any attempt to reach these levels in any of these four various Precious Metals would present a very strong buying opportunity for skilled technical traders. If it were to happen while a US stock market volatility event was taking place and/or the US stock market began a new downside price decline, then skilled traders should understand we may be seeing a similar type of price rotation event to the one that took place in February/March 2020 – representing a fantastic trading opportunity for those lucky enough to take advantage of the discounted price levels.
Before you continue, be sure to opt-in to our free-market trend signals before closing this page so you don’t miss our next special report!
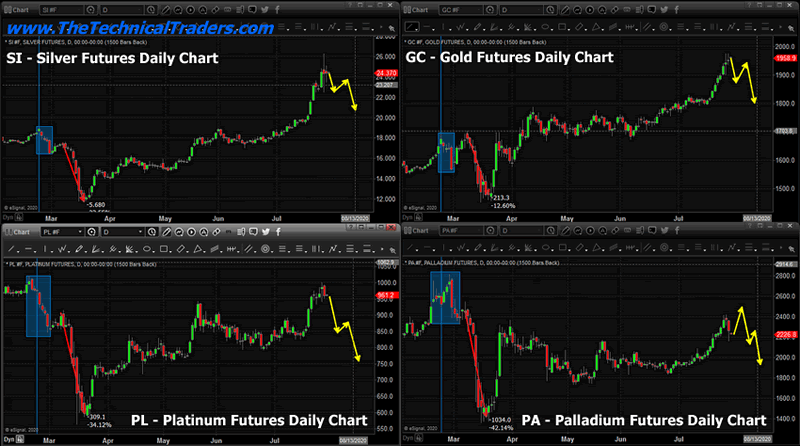
This next chart highlights what we believe may be the downside price event as it potentially takes place over the next 10 to 20+ days. Pay special attention to the differences in how Silver, Gold, Platinum, and Palladium react to the fear event and where real opportunity exists near the end of this potential event. Platinum and Palladium will likely fall 15% to 25% where Gold may fall only 8% and Silver may fall 15% to 20% before bottoming.
As technical traders, we can’t pass up an opportunity like this when Precious Metals gift us with a potential 15% to 45%+ rotation in price that should be moderately easy to trade given our expectations. If this event takes place as we have described, skilled technical traders could begin to acquire smaller positions near our target levels, then wait to acquire bigger positions as the bottom sets up. Take a look at how Gold and Silver rallied after the February/March collapse – Gold rallied back to new highs within 45 days whereas Silver rallied higher over 4+ months, then broke higher just recently on a huge upside breakout move. Platinum and Palladium rotated more diligently throughout a 90-day span – never really reaching new highs after the peak in February 2020.
The reality of patterns like this is they are fun and exciting to find at this early stage of the setup. We’re not 100% confident this pattern will play out as we expect yet – but we believe the probability is high that a volatility event is about to take place and that Precious Metals could react very similarly to the February/March 2020 price reactions again.
Quick Video Clip On Silver & Gold Predictions
https://youtu.be/n7vCQ0XjrlE
As technical traders, we love this type of “telegraphed event” – even if it does not take place exactly as the previous event took place. It means we have an opportunity to take advantage of increased volatility and price rotation in one of our favorite sectors – METALS. Get ready for this move if we are correct – it may be your last chance to buy Gold and Silver at deep discounts for quite a while.
Get our Active ETF Swing Trade Signals or if you have any type of retirement account and are looking for signals when to own equities, bonds, or cash, be sure to become a member of my Passive Long-Term ETF Investing Signals which we are about to issue a new signal for subscribers.
Chris Vermeulen
www.TheTechnicalTraders.com
Chris Vermeulen has been involved in the markets since 1997 and is the founder of Technical Traders Ltd. He is an internationally recognized technical analyst, trader, and is the author of the book: 7 Steps to Win With Logic
Through years of research, trading and helping individual traders around the world. He learned that many traders have great trading ideas, but they lack one thing, they struggle to execute trades in a systematic way for consistent results. Chris helps educate traders with a three-hour video course that can change your trading results for the better.
His mission is to help his clients boost their trading performance while reducing market exposure and portfolio volatility.
He is a regular speaker on HoweStreet.com, and the FinancialSurvivorNetwork radio shows. Chris was also featured on the cover of AmalgaTrader Magazine, and contributes articles to several leading financial hubs like MarketOracle.co.uk
Disclaimer: Nothing in this report should be construed as a solicitation to buy or sell any securities mentioned. Technical Traders Ltd., its owners and the author of this report are not registered broker-dealers or financial advisors. Before investing in any securities, you should consult with your financial advisor and a registered broker-dealer. Never make an investment based solely on what you read in an online or printed report, including this report, especially if the investment involves a small, thinly-traded company that isn’t well known. Technical Traders Ltd. and the author of this report has been paid by Cardiff Energy Corp. In addition, the author owns shares of Cardiff Energy Corp. and would also benefit from volume and price appreciation of its stock. The information provided here within should not be construed as a financial analysis but rather as an advertisement. The author’s views and opinions regarding the companies featured in reports are his own views and are based on information that he has researched independently and has received, which the author assumes to be reliable. Technical Traders Ltd. and the author of this report do not guarantee the accuracy, completeness, or usefulness of any content of this report, nor its fitness for any particular purpose. Lastly, the author does not guarantee that any of the companies mentioned in the reports will perform as expected, and any comparisons made to other companies may not be valid or come into effect.
Chris Vermeulen Archive |
© 2005-2022 http://www.MarketOracle.co.uk - The Market Oracle is a FREE Daily Financial Markets Analysis & Forecasting online publication.