


How We Called the Stock Market Crash of 2008
Stock-Markets / Financial Crash Oct 12, 2008 - 07:48 AM GMT

 We wrote in our September 12th, weekend newsletter, page 7, “September 29th could be a kickoff to a devastating stock market crash.” That has proven true to the precise day, the Industrials crashing 3,260 points, or 29 percent since September 29th. But, how did we know?
There were several key indicators and patterns converging like the perfect storm. While we believed back in the spring that this autumn was to see a huge decline, in early September it became apparent to us that a crash similar in magnitude and scope to 1929's and 1987's was just a few weeks from starting.
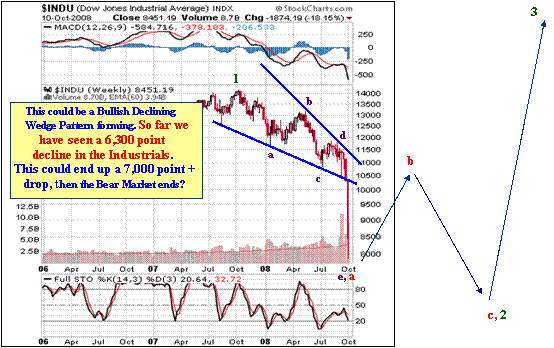
First, we identified a huge Declining Bullish Wedge pattern , one that started back at the October 2007 top, when the Industrials hit an all-time high of 14,198 on October 11th . The pattern had formed perfect converging trendlines, drawn from connecting decline tops with declining tops, and declining bottoms with declining bottoms over the past year, with prices now reaching position for the last leg of this pattern, a devastating drop below the bottom boundary. Prices had reached that bottom boundary, which meant the time had arrived for the necessary and expectant plunge, wave e down. That pattern is attached below.
Second, we had a phi mate turn date set for September 29th , which was also a New Moon. Our studies of market crashes have shown that many major declines start at New Moons. Since this was coming on our next phi mate turn date (which is a cycle pattern of major tops and bottoms arriving a Fibonacci number of trading days from previous tops and bottoms), and given the need for a coming wave e down in the Bullish Declining Wedge pattern, we concluded a stock market crash would start on September 29th .
Third, we knew fundamental economic conditions were deteriorating rapidly , that we were in the traditionally bad autumn season for stocks, so we were on high alert for an imminent stock market crash.
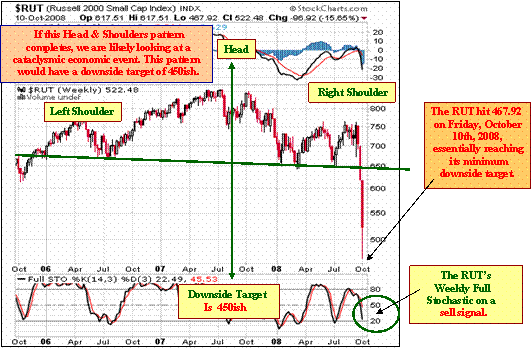
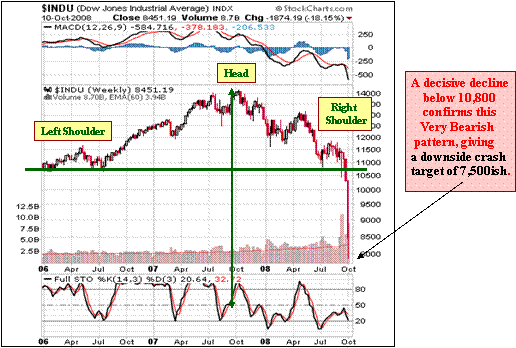
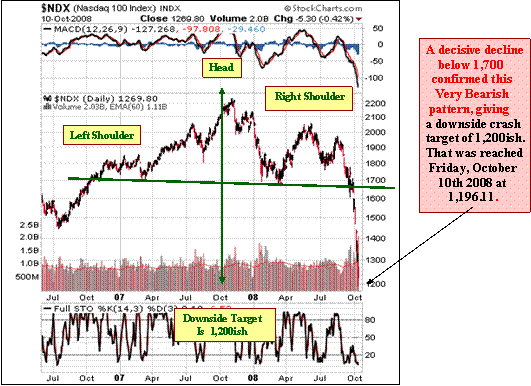
Fourth, we had found several Head & Shoulders top patterns in major indices that suggested we were headed for a major stock market crash , as they had minimum downside targets that were 25 percent below price levels in early September, and that momentum indicators were suggesting prices would violate the necklines of those patterns around the end of September.
Fifth, we did some projections with our proprietary Plunge Protection Team Indicator and came to the conclusion it would be generating a sell signal within a day or so of September 30th , 2008. That sell signal came October 1 st .
Our subscribers were prepared, as they were given this information ahead of time, in our September 12 th , 2008 Weekend Newsletter, with a stock market crash warning that mentioned the specific day it would start.
You can grab a subscription at www.technicalindicatorindex.com , which will provide you with Daily and expanded Weekend Newsletters, and a Daily emailed Executive Summary of the Markets. For a Free 30 Day Trial, click on the button at the upper right of our home page.
“Jesus said to them, “I am the bread of life; he who comes to Me
shall not hunger, and he who believes in Me shall never thirst.
For I have come down from heaven,
For this is the will of My Father, that everyone who beholds
the Son and believes in Him, may have eternal life;
and I Myself will raise him up on the last day.”
John 6: 35, 38, 40
by Robert McHugh, Ph.D.
technicalindicatorindex.com
Robert McHugh Ph.D. is President and CEO of Main Line Investors, Inc., a registered investment advisor in the Commonwealth of Pennsylvania, and can be reached at www.technicalindicatorindex.com.
The statements, opinions, buy and sell signals, and analyses presented in this newsletter are provided as a general information and education service only. Opinions, estimates, buy and sell signals, and probabilities expressed herein constitute the judgment of the author as of the date indicated and are subject to change without notice. Nothing contained in this newsletter is intended to be, nor shall it be construed as, investment advice, nor is it to be relied upon in making any investment or other decision. Prior to making any investment decision, you are advised to consult with your broker, investment advisor or other appropriate tax or financial professional to determine the suitability of any investment. Neither Main Line Investors, Inc. nor Robert D. McHugh, Jr., Ph.D. Editor shall be responsible or have any liability for investment decisions based upon, or the results obtained from, the information provided. Copyright 2008, Main Line Investors, Inc. All Rights Reserved.
Robert McHugh, Ph.D Archive |
© 2005-2022 http://www.MarketOracle.co.uk - The Market Oracle is a FREE Daily Financial Markets Analysis & Forecasting online publication.