


Stock Market Dow Jones Utilities Breaking Trend
Stock-Markets / Stock Markets 2020 Sep 02, 2020 - 06:33 PM GMTBy: Chris_Vermeulen

RESEARCH HIGHLIGHTS:
- Dow Theory suggests indices must confirm each other and volume must confirm the trend.
- The new downward trend in the Dow Utilities Index suggests indices are starting to break apart in terms of trending in unison.
- Volume recently has been trailing lower, which suggests the momentum behind these new all-time highs is weakening.
- If the Utilities Index continues to move lower and we see increased volume in the selling trend, we will consider the Dow Theory Trend component “broken” and expect a major peak/top soon after.
We know some of you are Dow Theory enthusiasts and followers. We follow the Transportation Index as a leading indicator for potential major market trends almost exclusively because of what we have learned from Dow Theory. If you are unfamiliar with Dow Theory, we suggest visiting Investopedia’s summary of this technical theory for a quick refresher. You can also learn more about the primary indicator in Dow Theory here. The two most important aspects of Dow Theory that we are researching today are two components:
- Indices Must Confirm Each Other
- Volume Must Confirm The Trend
My researchers and I have identified that the Dow Jones Utility Index has started to break downward in trend, breaking the recent upside price trend. This breakdown in the Utilities Index suggests the Indices are starting to break apart in terms of trending in unison. We have not seen increased volume in the downward trending of the Utility Index yet and we are waiting for this technical trigger to confirm the Breakdown in Dow Theory Trending by watching for the Utility Index to potentially begin a broader downside price move with increased volume.
IS DOW THEORY SIGNALING A BREAKDOWN IN TREND
Our research team is focusing on the Dow Jones Industrial Average, the Dow Jones Transportation Index, and the Dow Jones Utility Index for this article. These three charts are key to understand the broader components of Dow Theory and how the technical and trending aspects of Dow Theory work. We’re focusing on the Utilities Index because it is diverging from the Industrials and Transports in a big way. We just need to see some Volume support this new downtrend in the Utilities Index to begin to raise some big RED FLAGS about a major market top setting up.
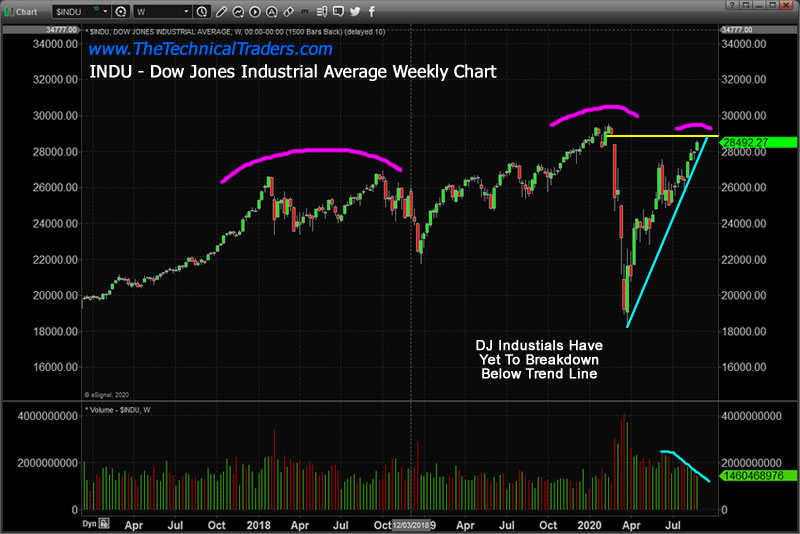
Let’s start by investigating the Dow Jones Industrial Weekly Chart, below. We’ve highlighted the broader Head-and-Shoulders pattern in MAGENTA as well as drawn a YELLOW LINE across the UPPER GAP range from the February COVID-19 market collapse. We believe these levels will be critical in understanding how the markets are poised to test and potentially break above these broader market resistance levels. Additionally, we’ve drawn an upward sloping CYAN trend line that shows you how diligently price has continued to move higher since the bottom setup in March 2020. There has been very little recent weakness in the advance of price as new highs continue to be reached.
Volume recently has been trailing lower, which suggests the momentum behind these new all-time highs is weakening. It appears many traders are sitting on the sidelines and not participating in this upside price rally out of fear or concern that it may not be sustainable.
PRIMARY TRENDS HAVE THREE PHASES
A primary trend will pass through three phases, according to the Dow theory. In a bull market, these are the accumulation phase, the public participation (or big move) phase, and the excess phase. In a bear market, they are called the distribution phase, the public participation phase, and the panic (or despair) phase. It is quite possible that we have moved past the accumulation and public participation phases and are now firmly within the “excess phase” .. Or what we call the “speculative phase”.
Before you continue, be sure to opt-in to our free-market trend signalsnow so you don’t miss our next special report!
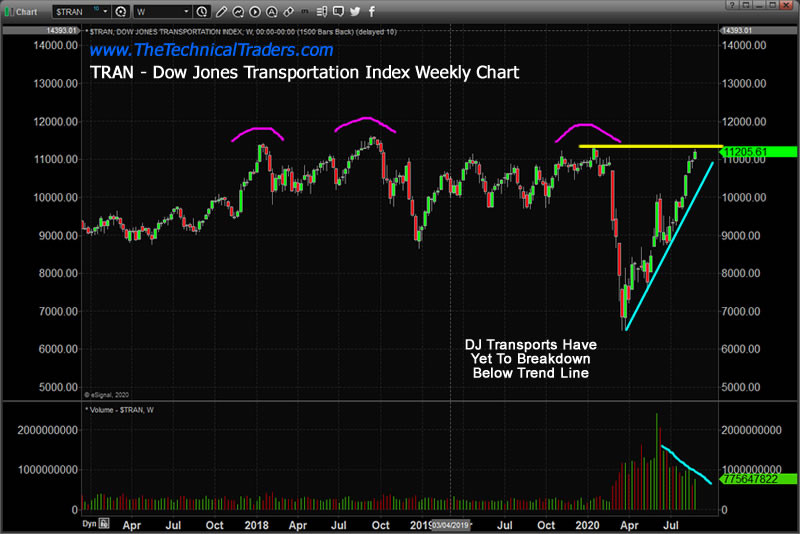
Now we will look at the Dow Jones Transportation Index, below, which is set up somewhat similar to the Industrials. We see an extended Head-and-Shoulders pattern setup with a high price level from the Right-Shoulder acting as current resistance. We also see a very solid upward price trend which has accelerated higher over the past 5+ weeks on diminishing volume. At this point, we should consider the Industrials and the Transports “in alignment” with one another. The only real concern related to a weakening trend is the diminishing volume on both of these charts.
Now, we add the Dow Jones Utilities Index, below again, which sets up the entire Peaking/Topping Dow Theory technical pattern. The first thing we see in this Dow Jones Utilities Weekly chart is that the recent price trend is moving lower. This contradicts the trends of the Industrials and Transports. Next, we see a much clearer Head-and-Shoulders pattern set up in the Utilities Index – which suggests resistance near 850 may play a big role in future price activity. Lastly, we see diminishing volume in this recent downtrend of price – which suggests “capitulation” has yet to enter this downward price trend.
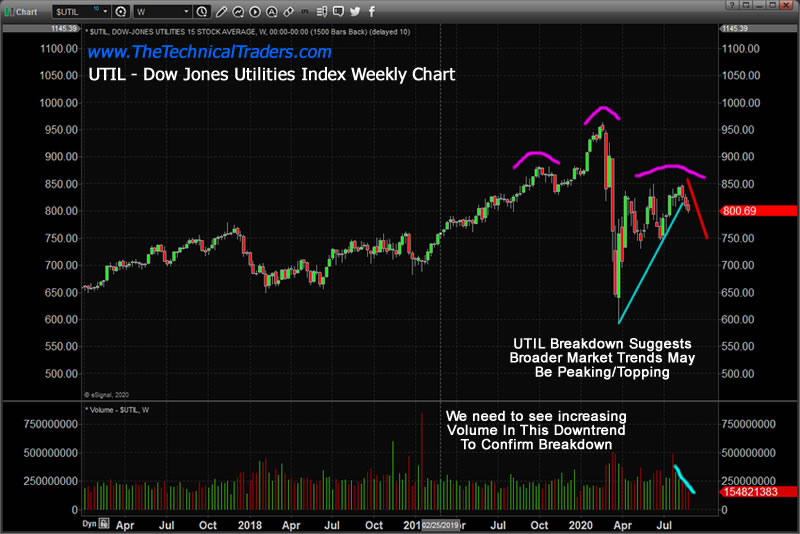
Our researchers believe the only thing missing from the Utilities breakdown, which would indicate a broader market peak is setting up, is increased volume while the Utilities continue to trend lower. Once this technical pattern sets up, we believe we would have enough technical confirmation of a breakdown of the Dow Theory Trend Alignment component to warn that a major market peak/top is very near (or already happened).
What this means for skilled technical traders is that you should start “hedging” against risk and considering how to protect your open long positions. If you have not already considered how to accomplish this, we would suggest Precious Metals, Miners, Bonds and possibly small positions in Inverse ETF (such as SDS or QID). Hedging is a very valuable tool for skilled technical traders when trends weaken or risks become more evident in the markets. Moving capital into positions that can help protect against loss can help to balance your portfolio and reduce exposure to risk factors.
In closing, we do not have confirmation of this Dow Theory technical pattern yet. All we need to see is for the Utilities Index to continue to move lower and to see increased volume in the selling trend. Once we see this, we’ll consider the Dow Theory Trend component “broken” and we believe a major peak/top won’t be too far away. We suggest all of you pay close attention to these three indexes and watch for a breakdown of the primary trends in the future. This is a great way for you to understand basic Dow Theory and the how broad market trends tend to work in “alignment” or “unison”.
Hedge accordingly. We could be in for a wild ride in this breakdown confirms with increased volume. If you want to survive the trading over a long period of time, then you learn fairly quickly how important it is to protect against risk and to properly size your trades. Subscribers of my Active ETF Swing Trading Newsletter can ride my coattails as I navigate these financial markets and build wealth. My research and trading team are here to help you find better trades and navigate these incredibly crazy market trends.
While most of us have active trading accounts, what is even more important are our long-term investment and retirement accounts. Why? Because they are, in most cases, our largest store of wealth other than our homes, and if they are not protected during the next bear market, you could lose 25-50% or more of your net worth. The good news is we can preserve and even grow our long term capital when things get ugly (likely soon) and I will show you how. We’ve recently issued a Long-term Investment Signal for subscribers of our Technical Investor newsletter. Be sure to become a member of my Passive Long-Term ETF Investing Signals.
Chris Vermeulen
www.TheTechnicalTraders.com
Chris Vermeulen has been involved in the markets since 1997 and is the founder of Technical Traders Ltd. He is an internationally recognized technical analyst, trader, and is the author of the book: 7 Steps to Win With Logic
Through years of research, trading and helping individual traders around the world. He learned that many traders have great trading ideas, but they lack one thing, they struggle to execute trades in a systematic way for consistent results. Chris helps educate traders with a three-hour video course that can change your trading results for the better.
His mission is to help his clients boost their trading performance while reducing market exposure and portfolio volatility.
He is a regular speaker on HoweStreet.com, and the FinancialSurvivorNetwork radio shows. Chris was also featured on the cover of AmalgaTrader Magazine, and contributes articles to several leading financial hubs like MarketOracle.co.uk
Disclaimer: Nothing in this report should be construed as a solicitation to buy or sell any securities mentioned. Technical Traders Ltd., its owners and the author of this report are not registered broker-dealers or financial advisors. Before investing in any securities, you should consult with your financial advisor and a registered broker-dealer. Never make an investment based solely on what you read in an online or printed report, including this report, especially if the investment involves a small, thinly-traded company that isn’t well known. Technical Traders Ltd. and the author of this report has been paid by Cardiff Energy Corp. In addition, the author owns shares of Cardiff Energy Corp. and would also benefit from volume and price appreciation of its stock. The information provided here within should not be construed as a financial analysis but rather as an advertisement. The author’s views and opinions regarding the companies featured in reports are his own views and are based on information that he has researched independently and has received, which the author assumes to be reliable. Technical Traders Ltd. and the author of this report do not guarantee the accuracy, completeness, or usefulness of any content of this report, nor its fitness for any particular purpose. Lastly, the author does not guarantee that any of the companies mentioned in the reports will perform as expected, and any comparisons made to other companies may not be valid or come into effect.
Chris Vermeulen Archive |
© 2005-2022 http://www.MarketOracle.co.uk - The Market Oracle is a FREE Daily Financial Markets Analysis & Forecasting online publication.